Regions Bank 2009 Annual Report Download - page 152
Download and view the complete annual report
Please find page 152 of the 2009 Regions Bank annual report below. You can navigate through the pages in the report by either clicking on the pages listed below, or by using the keyword search tool below to find specific information within the annual report.-
 1
1 -
2
-
3
-
4
-
5
-
6
-
7
-
8
-
9
-
10
-
11
-
12
-
13
-
14
-
15
-
16
-
17
-
18
-
19
-
20
-
21
-
22
-
23
-
24
-
25
-
26
-
27
-
28
-
29
-
30
-
31
-
32
-
33
-
34
-
35
-
36
-
37
-
38
-
39
-
40
-
41
-
42
-
43
-
44
-
45
-
46
-
47
-
48
-
49
-
50
-
51
-
52
-
53
-
54
-
55
-
56
-
57
-
58
-
59
-
60
-
61
-
62
-
63
-
64
-
65
-
66
-
67
-
68
-
69
-
70
-
71
-
72
-
73
-
74
-
75
-
76
-
77
-
78
-
79
-
80
-
81
-
82
-
83
-
84
-
85
-
86
-
87
-
88
-
89
-
90
-
91
-
92
-
93
-
94
-
95
-
96
-
97
-
98
-
99
-
100
-
101
-
102
-
103
-
104
-
105
-
106
-
107
-
108
-
109
-
110
-
111
-
112
-
113
-
114
-
115
-
116
-
117
-
118
-
119
-
120
-
121
-
122
-
123
-
124
-
125
-
126
-
127
-
128
-
129
-
130
-
131
-
132
-
133
-
134
-
135
-
136
-
137
-
138
-
139
-
140
-
141
-
 142
142 -
 143
143 -
 144
144 -
 145
145 -
 146
146 -
 147
147 -
 148
148 -
 149
149 -
 150
150 -
 151
151 -
 152
152 -
 153
153 -
 154
154 -
 155
155 -
 156
156 -
 157
157 -
 158
158 -
 159
159 -
 160
160 -
 161
161 -
 162
162 -
163
-
164
-
165
-
166
-
167
-
168
-
169
-
170
-
171
-
172
-
173
-
174
-
175
-
176
-
177
-
178
-
179
-
180
-
181
-
182
-
183
-
184
-
185
-
186
-
187
-
188
-
189
-
190
-
191
-
192
-
193
-
194
-
195
-
196
-
197
-
198
-
199
-
200
-
201
-
202
-
203
-
204
-
205
-
206
-
207
-
208
-
209
-
210
-
211
-
212
-
213
-
214
-
215
-
216
-
217
-
218
-
219
-
220
 |
 |

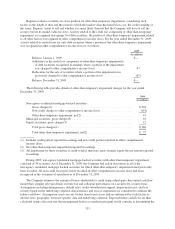
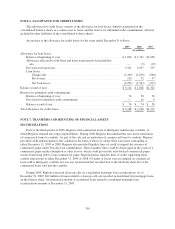
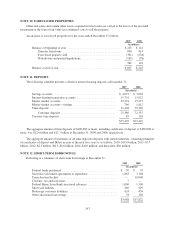
NOTE 6. ALLOWANCE FOR CREDIT LOSSES
The allowance for credit losses consists of the allowance for loan losses, which is presented on the
consolidated balance sheets as a contra-asset to loans, and the reserve for unfunded credit commitments, which is
included in other liabilities in the consolidated balance sheets.
An analysis of the allowance for credit losses for the years ended December 31 follows:
2009 2008 2007
(In millions)
Allowance for loan losses:
Balance at beginning of year ........................................ $1,826 $ 1,321 $1,056
Allowance allocated to sold loans and loans transferred to loans held for
sale .......................................................... — (5) (19)
Provision for loan losses ........................................... 3,541 2,057 555
Loan losses:
Charge-offs ................................................. (2,369) (1,639) (368)
Recoveries .................................................. 116 92 97
Net loan losses ............................................... (2,253) (1,547) (271)
Balance at end of year ................................................. $3,114 $ 1,826 $1,321
Reserve for unfunded credit commitments:
Balance at beginning of year ........................................ 74 58 52
Provision for unfunded credit commitments ............................ — 16 6
Balance at end of year ............................................. $ 74 $ 74 $ 58
Total allowance for credit losses ......................................... $3,188 $ 1,900 $1,379
NOTE 7. TRANSFERS AND SERVICING OF FINANCIAL ASSETS
SECURITIZATIONS
Prior to the third quarter of 2008, Regions sold commercial loans to third-party multi-issuer conduits, of
which Regions retained servicing responsibilities. During 2008, Regions discontinued the sale and securitization
of commercial loans to conduits. As part of the sale and securitization of commercial loans to conduits, Regions
provided credit enhancements to the conduits in the form of letters of credit; there were none outstanding at
either December 31, 2009 or 2008. Regions also provided liquidity lines of credit to support the issuance of
commercial paper under 364-day loan commitments. These liquidity lines could be drawn upon in the event of a
commercial paper market disruption or other factors, which could prevent the asset-backed commercial paper
issuers from being able to issue commercial paper. Regions had no liquidity lines of credit supporting these
conduit transactions at either December 31, 2009 or 2008. No gains or losses were recognized on commercial
loans sold to third-party conduits nor was any retained interest recorded due to the relatively short life of the
commercial loans sold into the conduits.
During 2009, Regions exercised clean-up calls on a residential mortgage loan securitizations. As of
December 31, 2009, $42 million of loans related to clean-up calls are recorded in residential first mortgage loans
on the balance sheet. An immaterial amount of securitized loans related to residential mortgage loan
securitizations remains at December 31, 2009.
138