Regions Bank 2009 Annual Report Download - page 186
Download and view the complete annual report
Please find page 186 of the 2009 Regions Bank annual report below. You can navigate through the pages in the report by either clicking on the pages listed below, or by using the keyword search tool below to find specific information within the annual report.-
 1
1 -
2
-
3
-
4
-
5
-
6
-
7
-
8
-
9
-
10
-
11
-
12
-
13
-
14
-
15
-
16
-
17
-
18
-
19
-
20
-
21
-
22
-
23
-
24
-
25
-
26
-
27
-
28
-
29
-
30
-
31
-
32
-
33
-
34
-
35
-
36
-
37
-
38
-
39
-
40
-
41
-
42
-
43
-
44
-
45
-
46
-
47
-
48
-
49
-
50
-
51
-
52
-
53
-
54
-
55
-
56
-
57
-
58
-
59
-
60
-
61
-
62
-
63
-
64
-
65
-
66
-
67
-
68
-
69
-
70
-
71
-
72
-
73
-
74
-
75
-
76
-
77
-
78
-
79
-
80
-
81
-
82
-
83
-
84
-
85
-
86
-
87
-
88
-
89
-
90
-
91
-
92
-
93
-
94
-
95
-
96
-
97
-
98
-
99
-
100
-
101
-
102
-
103
-
104
-
105
-
106
-
107
-
108
-
109
-
110
-
111
-
112
-
113
-
114
-
115
-
116
-
117
-
118
-
119
-
120
-
121
-
122
-
123
-
124
-
125
-
126
-
127
-
128
-
129
-
130
-
131
-
132
-
133
-
134
-
135
-
136
-
137
-
138
-
139
-
140
-
141
-
142
-
143
-
144
-
145
-
146
-
147
-
148
-
149
-
150
-
151
-
152
-
153
-
154
-
155
-
156
-
157
-
158
-
159
-
160
-
161
-
162
-
163
-
164
-
165
-
166
-
167
-
168
-
169
-
170
-
171
-
172
-
173
-
174
-
175
-
 176
176 -
 177
177 -
 178
178 -
 179
179 -
 180
180 -
 181
181 -
 182
182 -
 183
183 -
 184
184 -
 185
185 -
 186
186 -
 187
187 -
 188
188 -
 189
189 -
 190
190 -
 191
191 -
 192
192 -
 193
193 -
 194
194 -
 195
195 -
 196
196 -
197
-
198
-
199
-
200
-
201
-
202
-
203
-
204
-
205
-
206
-
207
-
208
-
209
-
210
-
211
-
212
-
213
-
214
-
215
-
216
-
217
-
218
-
219
-
220
 |
 |

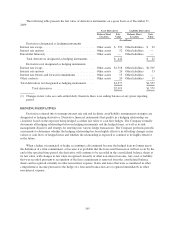
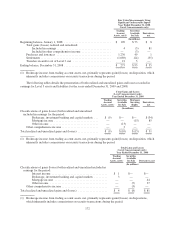
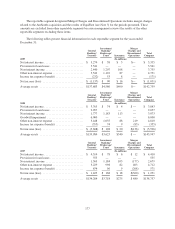
Fair Value Measurements Using
Significant Unobservable Inputs
Year Ended December 31, 2008
(Level 3 measurements only)
Trading
Account
Assets, net(1)
Securities
Available
for Sale
Derivatives,
net
(In millions)
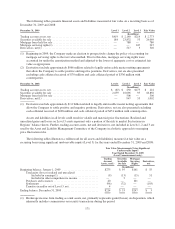
Beginning balance, January 1, 2008 ................................ $ 109 $73 $ 8
Total gains (losses) realized and unrealized:
Included in earnings ..................................... 4 (5) 81
Included in other comprehensive income .................... — (3) —
Purchases and issuances ..................................... 1,230 49 1
Settlements ................................................ (1,089) (24) (35)
Transfers in and/or out of Level 3, net .......................... 21 5 —
Ending balance, December 31, 2008 ................................ $ 275 $95 $ 55
(1) Brokerage income from trading account assets, net, primarily represents gains/(losses) on disposition, which
inherently includes commissions on security transactions during the period.
The following tables details the presentation of both realized and unrealized gains and losses recorded in
earnings for Level 3 assets and liabilities for the years ended December 31, 2009 and 2008:
Total Gains and Losses
(Level 3 measurements only)
Year Ended December 31, 2009
Trading
Account
Assets, net(1)
Securities
Available
for Sale
Mortgage
Servicing
Rights
Derivatives,
net
(In millions)
Classifications of gains (losses) both realized and unrealized
included in earnings for the period:
Brokerage, investment banking and capital markets . . . $ (9) $— $— $ (34)
Mortgage income .............................. — — (15) 85
Other income ................................. — (13) — —
Other comprehensive income ......................... — 3 — —
Total realized and unrealized gains and (losses) .............. $ (9) $(10) $ (15) $ 51
(1) Brokerage income from trading account assets, net, primarily represents gains/(losses) on disposition, which
inherently includes commissions on security transactions during the period.
Total Gains and Losses
(Level 3 measurements only)
Year Ended December 31, 2008
Trading
Account
Assets, net(1)
Securities
Available
for Sale Derivatives, net
(In millions)
Classifications of gains (losses) both realized and unrealized included in
earnings for the period:
Interest income ...................................... $ 1 $— $—
Brokerage, investment banking and capital markets ......... 3 — —
Mortgage income .................................... — — 44
Other income ....................................... — (5) 37
Other comprehensive income ............................... — (3) —
Total realized and unrealized gains and (losses) .................... $ 4 $ (8) $ 81
(1) Brokerage income from trading account assets, net, primarily represents gains/(losses) on dispositions,
which inherently includes commissions on security transactions during the period.
172