Regions Bank 2009 Annual Report Download - page 63
Download and view the complete annual report
Please find page 63 of the 2009 Regions Bank annual report below. You can navigate through the pages in the report by either clicking on the pages listed below, or by using the keyword search tool below to find specific information within the annual report.-
 1
1 -
2
-
3
-
4
-
5
-
6
-
7
-
8
-
9
-
10
-
11
-
12
-
13
-
14
-
15
-
16
-
17
-
18
-
19
-
20
-
21
-
22
-
23
-
24
-
25
-
26
-
27
-
28
-
29
-
30
-
31
-
32
-
33
-
34
-
35
-
36
-
37
-
38
-
39
-
40
-
41
-
42
-
43
-
44
-
45
-
46
-
47
-
48
-
49
-
50
-
51
-
52
-
 53
53 -
 54
54 -
 55
55 -
 56
56 -
 57
57 -
 58
58 -
 59
59 -
 60
60 -
 61
61 -
 62
62 -
 63
63 -
 64
64 -
 65
65 -
 66
66 -
 67
67 -
 68
68 -
 69
69 -
 70
70 -
 71
71 -
 72
72 -
 73
73 -
74
-
75
-
76
-
77
-
78
-
79
-
80
-
81
-
82
-
83
-
84
-
85
-
86
-
87
-
88
-
89
-
90
-
91
-
92
-
93
-
94
-
95
-
96
-
97
-
98
-
99
-
100
-
101
-
102
-
103
-
104
-
105
-
106
-
107
-
108
-
109
-
110
-
111
-
112
-
113
-
114
-
115
-
116
-
117
-
118
-
119
-
120
-
121
-
122
-
123
-
124
-
125
-
126
-
127
-
128
-
129
-
130
-
131
-
132
-
133
-
134
-
135
-
136
-
137
-
138
-
139
-
140
-
141
-
142
-
143
-
144
-
145
-
146
-
147
-
148
-
149
-
150
-
151
-
152
-
153
-
154
-
155
-
156
-
157
-
158
-
159
-
160
-
161
-
162
-
163
-
164
-
165
-
166
-
167
-
168
-
169
-
170
-
171
-
172
-
173
-
174
-
175
-
176
-
177
-
178
-
179
-
180
-
181
-
182
-
183
-
184
-
185
-
186
-
187
-
188
-
189
-
190
-
191
-
192
-
193
-
194
-
195
-
196
-
197
-
198
-
199
-
200
-
201
-
202
-
203
-
204
-
205
-
206
-
207
-
208
-
209
-
210
-
211
-
212
-
213
-
214
-
215
-
216
-
217
-
218
-
219
-
220
 |
 |
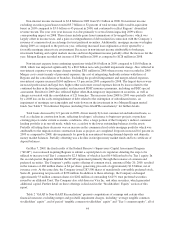
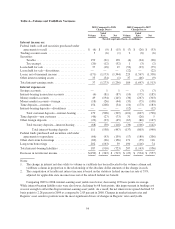
estimates related to the level of credit losses inherent in the portfolio at year-end. A full discussion of these
estimates and other factors can be found in the “Allowance for Credit Losses” section within the discussion of
credit risk, found in a later section of this report.
The allowance is sensitive to a variety of internal factors, such as portfolio performance and assigned risk
ratings, and external factors, such as interest rates and the general health of the economy. Management reviews
scenarios having different assumptions for variables that could result in increases or decreases in probable
inherent credit losses, which may materially impact Regions’ estimate of the allowance and results of operations.
Management’s estimate of the allowance for commercial products, which includes commercial,
construction, and commercial real estate mortgage loans, could be affected by risk rating upgrades or
downgrades as a result of fluctuations in the general economy, developments within a particular industry, or
changes in an individual’s credit due to factors particular to that credit, such as competition, management or
business performance. A reasonably possible scenario would be an estimated 20 percent migration of lower risk-
related pass credits to criticized status, which could increase estimated inherent losses by approximately $214
million. A 20 percent reduction in the level of criticized credits is also a reasonably possible scenario, which
would result in an approximate $225 million decrease in estimated inherent losses.
For residential real estate mortgages, home equity lending and other consumer-related loans, individual
products are reviewed on a group basis or in loan pools (e.g., residential real estate mortgage pools). The total of
all residential loans, including residential real estate mortgages and home equity lending, represents
approximately 34 percent of total loans. Losses can be affected by such factors as collateral value, loss severity,
the economy and other uncontrollable factors. A 20-basis-point increase or decrease in the estimated loss rates on
these residential loans would change estimated inherent losses by approximately $62 million. The loss analysis
related to other consumer-related loans includes reasonably possible scenarios with estimated loss rates
increasing or decreasing by 50 basis points, which would increase or decrease the related estimated inherent
losses by approximately $18 million, respectively.
Additionally, the estimate of the allowance for credit losses for the entire portfolio may change due to
modifications in the mix and level of loan balances outstanding and general economic conditions, as evidenced
by changes in real estate demand and values, interest rates, unemployment rates, bankruptcy filings, real estate
demand and values, fluctuations in the gross domestic product, and the effects of weather and natural disasters
such as droughts and hurricanes. Each has the ability to result in actual loan losses that could differ from
originally estimated amounts.
The pro forma inherent loss analysis presented above demonstrates the sensitivity of the allowance to key
assumptions. This sensitivity analysis does not reflect an expected outcome.
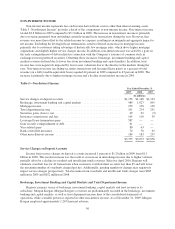
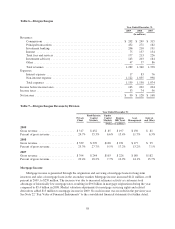
Fair Value Measurements
A portion of the Company’s assets and liabilities is carried at fair value, with changes in fair value recorded
either in earnings or other comprehensive income (loss). These include trading account assets, securities
available for sale, mortgage loans held for sale, mortgage servicing rights and derivatives (net). From time to
time, the estimation of fair value also affects other loans held for sale, which are recorded at the lower of cost or
fair value. Fair value determination is also relevant for certain other assets such as foreclosed property and other
real estate, which are recorded at the lower of the recorded investment in the loan/property or fair value, less
estimated costs to sell the property. The determination of fair value also impacts certain other assets that are
periodically evaluated for impairment using fair value estimates, including goodwill, other identifiable intangible
assets and impaired loans.
Fair value is generally defined as the price that would be received to sell an asset or paid to transfer a
liability (an exit price) as opposed to the price that would be paid to acquire the asset or received to assume the
49