Regions Bank 2009 Annual Report Download - page 6
Download and view the complete annual report
Please find page 6 of the 2009 Regions Bank annual report below. You can navigate through the pages in the report by either clicking on the pages listed below, or by using the keyword search tool below to find specific information within the annual report.-
 1
1 -
 2
2 -
 3
3 -
 4
4 -
 5
5 -
 6
6 -
 7
7 -
 8
8 -
 9
9 -
 10
10 -
 11
11 -
 12
12 -
 13
13 -
 14
14 -
 15
15 -
 16
16 -
 17
17 -
18
-
19
-
20
-
21
-
22
-
23
-
24
-
25
-
26
-
27
-
28
-
29
-
30
-
31
-
32
-
33
-
34
-
35
-
36
-
37
-
38
-
39
-
40
-
41
-
42
-
43
-
44
-
45
-
46
-
47
-
48
-
49
-
50
-
51
-
52
-
53
-
54
-
55
-
56
-
57
-
58
-
59
-
60
-
61
-
62
-
63
-
64
-
65
-
66
-
67
-
68
-
69
-
70
-
71
-
72
-
73
-
74
-
75
-
76
-
77
-
78
-
79
-
80
-
81
-
82
-
83
-
84
-
85
-
86
-
87
-
88
-
89
-
90
-
91
-
92
-
93
-
94
-
95
-
96
-
97
-
98
-
99
-
100
-
101
-
102
-
103
-
104
-
105
-
106
-
107
-
108
-
109
-
110
-
111
-
112
-
113
-
114
-
115
-
116
-
117
-
118
-
119
-
120
-
121
-
122
-
123
-
124
-
125
-
126
-
127
-
128
-
129
-
130
-
131
-
132
-
133
-
134
-
135
-
136
-
137
-
138
-
139
-
140
-
141
-
142
-
143
-
144
-
145
-
146
-
147
-
148
-
149
-
150
-
151
-
152
-
153
-
154
-
155
-
156
-
157
-
158
-
159
-
160
-
161
-
162
-
163
-
164
-
165
-
166
-
167
-
168
-
169
-
170
-
171
-
172
-
173
-
174
-
175
-
176
-
177
-
178
-
179
-
180
-
181
-
182
-
183
-
184
-
185
-
186
-
187
-
188
-
189
-
190
-
191
-
192
-
193
-
194
-
195
-
196
-
197
-
198
-
199
-
200
-
201
-
202
-
203
-
204
-
205
-
206
-
207
-
208
-
209
-
210
-
211
-
212
-
213
-
214
-
215
-
216
-
217
-
218
-
219
-
220
 |
 |

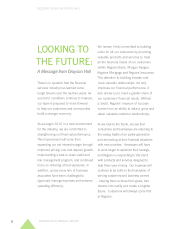
Banking at Regions is a very simple
and straightforward business, with the
foundation centered on maintaining our
focus on our customers. By keeping
our customers’ needs at the core of our
business decisions, we will continue to
provide competitive but proven products
that build value over the long term
and assist customers in achieving their
fi nancial goals.
2009 FINANCIAL RESULTS
While I am not pleased with Regions’
loss in 2009 of $1.3 billion, or $1.27
per share, these results were heavily
impacted by credit quality and economic
challenges. Specifi cally, the results refl ect
a $3.5 billion loan loss provision, which
is a result of aggressive efforts to address
credit quality problems in a number of
specifi c areas. We also made progress
with the deceleration of assets moving
to non-performing status, driven in large
part by our disposition of $2.7 billion in
problem assets over the past 15 months.
We are confi dent that the actions we have
taken to deal with non-performing assets
will put us in a stronger position once
the environment begins to improve.
Non-performing assets, excluding loans
held for sale, as a percentage of total
loans and repossessed assets, were
4.49% at December 31, 2009, compared
to 1.33% a year earlier. However, infl ows
of new non-performing assets peaked in
the second quarter and declined in the
quarters that followed. Net charge-offs
increased to 2.38% of average loans,
up from 1.59% a year earlier.
Revenues from Regions’ fee income-
producing businesses for 2009 were
$3.8 billion as compared to $3.1 billion
for 2008. Despite higher credit-related
costs, we were able to keep noninterest
expenses in check by focusing on rigorous
expense management and improved
operating effi ciencies.
The net interest margin steadied in late
2009, due to an ongoing positive shift in
funding mix coupled with better pricing
on loans and deposits. Regions’ deposit-
gathering efforts were successful due in
large part to our goal of opening 1 million
checking accounts during the year. The
Road to a Million Checking campaign
increased total customer deposits by 9%
during 2009, and we are encouraged by
this momentum as we begin 2010.
Capital ratios throughout 2009 remained
strong, fi nishing the year with a Tier
1 ratio at 11.5 percent and a Tier 1
Common ratio at a very solid 7.2 percent.
Regions’ capital ratios are comparable
to our peers. This capital reinforces our
ability to continue to be a safe harbor to
customers and their deposits.
The actions we have taken to deal
with non-performing assets will put
us in a stronger position once the
environment begins to improve.
MESSAGE FROM C. DOWD RITTER
REGIONS 2009 ANNUAL REPORT
4