Regions Bank 2009 Annual Report Download - page 57
Download and view the complete annual report
Please find page 57 of the 2009 Regions Bank annual report below. You can navigate through the pages in the report by either clicking on the pages listed below, or by using the keyword search tool below to find specific information within the annual report.-
 1
1 -
2
-
3
-
4
-
5
-
6
-
7
-
8
-
9
-
10
-
11
-
12
-
13
-
14
-
15
-
16
-
17
-
18
-
19
-
20
-
21
-
22
-
23
-
24
-
25
-
26
-
27
-
28
-
29
-
30
-
31
-
32
-
33
-
34
-
35
-
36
-
37
-
38
-
39
-
40
-
41
-
42
-
43
-
44
-
45
-
46
-
 47
47 -
 48
48 -
 49
49 -
 50
50 -
 51
51 -
 52
52 -
 53
53 -
 54
54 -
 55
55 -
 56
56 -
 57
57 -
 58
58 -
 59
59 -
 60
60 -
 61
61 -
 62
62 -
 63
63 -
 64
64 -
 65
65 -
 66
66 -
 67
67 -
68
-
69
-
70
-
71
-
72
-
73
-
74
-
75
-
76
-
77
-
78
-
79
-
80
-
81
-
82
-
83
-
84
-
85
-
86
-
87
-
88
-
89
-
90
-
91
-
92
-
93
-
94
-
95
-
96
-
97
-
98
-
99
-
100
-
101
-
102
-
103
-
104
-
105
-
106
-
107
-
108
-
109
-
110
-
111
-
112
-
113
-
114
-
115
-
116
-
117
-
118
-
119
-
120
-
121
-
122
-
123
-
124
-
125
-
126
-
127
-
128
-
129
-
130
-
131
-
132
-
133
-
134
-
135
-
136
-
137
-
138
-
139
-
140
-
141
-
142
-
143
-
144
-
145
-
146
-
147
-
148
-
149
-
150
-
151
-
152
-
153
-
154
-
155
-
156
-
157
-
158
-
159
-
160
-
161
-
162
-
163
-
164
-
165
-
166
-
167
-
168
-
169
-
170
-
171
-
172
-
173
-
174
-
175
-
176
-
177
-
178
-
179
-
180
-
181
-
182
-
183
-
184
-
185
-
186
-
187
-
188
-
189
-
190
-
191
-
192
-
193
-
194
-
195
-
196
-
197
-
198
-
199
-
200
-
201
-
202
-
203
-
204
-
205
-
206
-
207
-
208
-
209
-
210
-
211
-
212
-
213
-
214
-
215
-
216
-
217
-
218
-
219
-
220
 |
 |
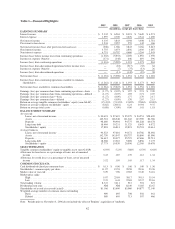
2009 OVERVIEW
The year ended December 31, 2009 was another difficult year for the U.S. economy and for the financial
services industry. High credit costs, primarily the result of loan portfolio pressure stemming from ongoing
deterioration in real estate values, as well as increasing unemployment and other factors, continued to negatively
impact pre-tax earnings. Property value declines, which began in late 2007, continued throughout 2008 and 2009.
While Regions did not have material exposure to many of the issues that originally plagued the industry (e.g.,
sub-prime loans, structured investment vehicles and collateralized debt obligations), the Company’s exposure to
the residential housing sector, primarily within investor real estate, pressured its loan portfolio, resulting in
increased credit costs and other real estate expenses. As the economic down cycle continued, consumer
confidence and weak economic conditions began to impact areas of the economy outside of the housing sector.
During 2009, the portion of the Company’s loan portfolio secured by income-producing commercial real estate,
including retail and multi-family properties, also showed signs of credit pressure.
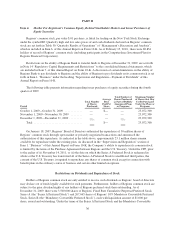
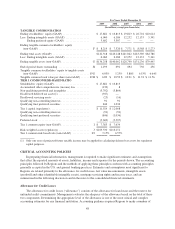
As a result of these factors, Regions reported a net loss available to common shareholders of $1.3 billion or
$1.27 per diluted common share in 2009. Significant drivers of 2009 results include an elevated provision for
loan losses and pressured net interest income. Offsetting these items to some extent was Regions’ solid fee and
mortgage income.
Net interest income was $3.3 billion in 2009 compared to $3.8 billion in 2008. The net interest margin
(taxable-equivalent basis) was 2.67% in 2009, compared to 3.23% during 2008. The decline in the net interest
margin was impacted primarily by factors directly and indirectly associated with the erosion of economic and
industry conditions since late 2007. These factors include Regions’ asset sensitive balance sheet, which was
impacted by an unfavorable decline in the general level and shape of the yield curve, higher spreads on new debt
issuances, and rising non-performing asset levels. Additionally, loan yields declined throughout the year, as
variable rate loans fell in response to declines in the short-term rates to which they are tied. Declining deposit
rates partially offset these movements, but the decline was somewhat limited by the competitive demand for
deposits within the industry, largely prompted by stressed economic conditions throughout the U.S. Entering
2010, the negative impacts to net interest income attributable to interest rate declines have largely worked their
way through the balance sheet. The net interest margin is expected to benefit from ongoing improvements to loan
pricing and deposit costs throughout the year. Additionally, if rates increase, Regions’ balance sheet is positioned
to respond incrementally more favorably.
Net charge-offs totaled $2.3 billion, or 2.38 percent of average loans in 2009 compared to $1.5 billion, or
1.59 percent of average loans in 2008. The increased loss rate reflected ongoing pressure in property valuations
and continued strains in the economy as a whole. Non-performing assets increased $2.7 billion between
December 31, 2009 and December 31, 2008 to $4.4 billion, primarily due to continued weakness in the
Company’s residential homebuilder and condominium portfolios. Non-performing loans held for sale totaled
$317 million and $423 million at December 31, 2009 and 2008, respectively.
The provision for loan losses is used to maintain the allowance for loan losses at a level that, in
management’s judgment, is adequate to cover losses inherent in the loan portfolio as of the balance sheet date.
During 2009, the provision for loan losses increased to $3.5 billion compared to $2.1 billion in 2008. The
increase in the provision was primarily due to continued deterioration in the residential homebuilder,
condominium, home equity, and income-producing investor-owned commercial real estate portfolios. The
recession, which was an outgrowth of a protracted national housing slump, continued to affect the real estate
industry throughout 2009. As a result, the Company experienced a significant migration of loans into
non-performing status. Loans secured by land, single-family residential, condominium and income-producing
investor real estate contributed to the inflows. As a result of the increased provision for loan losses and
significantly higher loan charge-offs, which increased $706 million, Regions increased its allowance for credit
losses to 3.52 percent of total loans, net of unearned income, at December 31, 2009, as compared to 1.95 percent
at December 31, 2008.
43