Regions Bank 2009 Annual Report Download - page 67
Download and view the complete annual report
Please find page 67 of the 2009 Regions Bank annual report below. You can navigate through the pages in the report by either clicking on the pages listed below, or by using the keyword search tool below to find specific information within the annual report.-
 1
1 -
2
-
3
-
4
-
5
-
6
-
7
-
8
-
9
-
10
-
11
-
12
-
13
-
14
-
15
-
16
-
17
-
18
-
19
-
20
-
21
-
22
-
23
-
24
-
25
-
26
-
27
-
28
-
29
-
30
-
31
-
32
-
33
-
34
-
35
-
36
-
37
-
38
-
39
-
40
-
41
-
42
-
43
-
44
-
45
-
46
-
47
-
48
-
49
-
50
-
51
-
52
-
53
-
54
-
55
-
56
-
 57
57 -
 58
58 -
 59
59 -
 60
60 -
 61
61 -
 62
62 -
 63
63 -
 64
64 -
 65
65 -
 66
66 -
 67
67 -
 68
68 -
 69
69 -
 70
70 -
 71
71 -
 72
72 -
 73
73 -
 74
74 -
 75
75 -
 76
76 -
 77
77 -
78
-
79
-
80
-
81
-
82
-
83
-
84
-
85
-
86
-
87
-
88
-
89
-
90
-
91
-
92
-
93
-
94
-
95
-
96
-
97
-
98
-
99
-
100
-
101
-
102
-
103
-
104
-
105
-
106
-
107
-
108
-
109
-
110
-
111
-
112
-
113
-
114
-
115
-
116
-
117
-
118
-
119
-
120
-
121
-
122
-
123
-
124
-
125
-
126
-
127
-
128
-
129
-
130
-
131
-
132
-
133
-
134
-
135
-
136
-
137
-
138
-
139
-
140
-
141
-
142
-
143
-
144
-
145
-
146
-
147
-
148
-
149
-
150
-
151
-
152
-
153
-
154
-
155
-
156
-
157
-
158
-
159
-
160
-
161
-
162
-
163
-
164
-
165
-
166
-
167
-
168
-
169
-
170
-
171
-
172
-
173
-
174
-
175
-
176
-
177
-
178
-
179
-
180
-
181
-
182
-
183
-
184
-
185
-
186
-
187
-
188
-
189
-
190
-
191
-
192
-
193
-
194
-
195
-
196
-
197
-
198
-
199
-
200
-
201
-
202
-
203
-
204
-
205
-
206
-
207
-
208
-
209
-
210
-
211
-
212
-
213
-
214
-
215
-
216
-
217
-
218
-
219
-
220
 |
 |

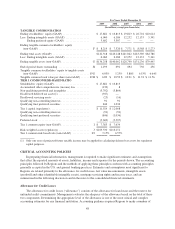
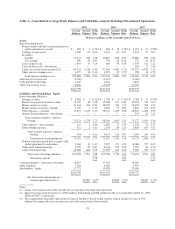
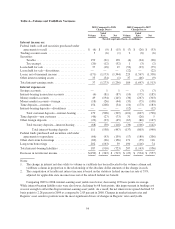
Table 3—Consolidated Average Daily Balances and Yield/Rate Analysis Including Discontinued Operations
2009 2008 2007
Average
Balance
Income/
Expense
Yield/
Rate
Average
Balance
Income/
Expense
Yield/
Rate
Average
Balance
Income/
Expense
Yield/
Rate
(Dollars in millions; yields on taxable-equivalent basis)
Assets
Interest-earning assets:
Federal funds sold and securities purchased
under agreements to resell ............ $ 503 $ 3 0.53% $ 868 $ 18 2.15% $ 1,021 $ 51 4.98%
Trading account assets ................. 1,599 65 4.04 1,473 66 4.47 1,441 72 5.01
Securities:
Taxable ........................... 20,221 966 4.78 16,897 828 4.90 16,982 856 5.04
Tax-exempt ....................... 460 29 6.45 754 61 8.10 737 63 8.52
Loans held for sale .................... 1,655 55 3.29 664 36 5.38 1,539 111 7.21
Loans held for sale—divestitures ......... — — — — — — 284 22 7.59
Loans, net of unearned income(1)(2) ...... 94,523 4,218 4.46 97,601 5,562 5.70 94,372 6,900 7.31
Other interest-earning assets ............ 6,927 28 0.40 1,873 29 1.55 588 38 6.55
Total interest-earning assets ........... 125,888 5,364 4.26 120,130 6,600 5.49 116,964 8,113 6.94
Allowance for loan losses ................ (2,240) (1,413) (1,063)
Cash and due from banks ................. 2,245 2,522 2,849
Other non-earning assets ................. 16,866 22,708 20,007
$142,759 $143,947 $138,757
Liabilities and Stockholders’ Equity
Interest-bearing liabilities:
Savings accounts ..................... $ 3,984 $ 5 0.12% $ 3,744 $ 4 0.12% $ 3,798 $ 11 0.29%
Interest-bearing transaction accounts ...... 14,347 40 0.28 15,058 127 0.84 15,553 312 2.00
Money market accounts ................ 21,434 181 0.84 18,269 326 1.79 19,455 629 3.23
Money market accounts—foreign ........ 1,139 3 0.22 2,828 47 1.64 3,822 155 4.05
Time deposits—customer .............. 32,617 1,045 3.20 28,301 1,099 3.88 28,525 1,282 4.49
Interest-bearing deposits—divestitures .... — — — — — — 374 12 3.23
Total customer deposits—interest-
bearing ......................... 73,521 1,274 1.73 68,200 1,603 2.35 71,527 2,401 3.36
Time deposits—non customer ........... 122 2 1.90 2,083 75 3.59 1,338 70 5.23
Other foreign deposits ................. 312 1 0.11 2,074 46 2.23 3,858 193 5.01
Total treasury deposits—interest-
bearing ....................... 434 3 0.61 4,157 121 2.91 5,196 263 5.06
Total interest-bearing deposits ..... 73,955 1,277 1.73 72,357 1,724 2.38 76,723 2,664 3.47
Federal funds purchased and securities sold
under agreements to repurchase ........ 3,166 12 0.37 7,697 171 2.22 8,080 377 4.67
Other short-term borrowings ............ 5,229 42 0.81 8,704 198 2.28 1,902 82 4.30
Long-term borrowings ................. 18,588 666 3.59 13,510 627 4.64 9,698 553 5.70
Total interest-bearing liabilities ...... 100,938 1,997 1.98 102,268 2,720 2.66 96,403 3,676 3.81
Net interest spread .............. 2.28 2.83 3.13
Customer deposits—non-interest-bearing .... 20,657 17,720 19,003
Other liabilities ......................... 3,391 4,020 3,315
Stockholders’ equity .................... 17,773 19,939 20,036
$142,759 $143,947 $138,757
Net interest income/margin on a
taxable-equivalent basis(3) ....... $3,367 2.67% $3,880 3.23% $4,437 3.79%
Notes:
(1) Loans, net of unearned income include non-accrual loans for all periods presented.
(2) Interest income includes loan fees of $30 million, $50 million and $78 million for the years ended December 31, 2009,
2008 and 2007, respectively.
(3) The computation of taxable-equivalent net interest income is based on the stautory federal income tax rate of 35%,
adjusted for applicable state income taxes net of the related federal tax benefit.
53