Regions Bank 2009 Annual Report Download - page 72
Download and view the complete annual report
Please find page 72 of the 2009 Regions Bank annual report below. You can navigate through the pages in the report by either clicking on the pages listed below, or by using the keyword search tool below to find specific information within the annual report.-
 1
1 -
2
-
3
-
4
-
5
-
6
-
7
-
8
-
9
-
10
-
11
-
12
-
13
-
14
-
15
-
16
-
17
-
18
-
19
-
20
-
21
-
22
-
23
-
24
-
25
-
26
-
27
-
28
-
29
-
30
-
31
-
32
-
33
-
34
-
35
-
36
-
37
-
38
-
39
-
40
-
41
-
42
-
43
-
44
-
45
-
46
-
47
-
48
-
49
-
50
-
51
-
52
-
53
-
54
-
55
-
56
-
57
-
58
-
59
-
60
-
61
-
 62
62 -
 63
63 -
 64
64 -
 65
65 -
 66
66 -
 67
67 -
 68
68 -
 69
69 -
 70
70 -
 71
71 -
 72
72 -
 73
73 -
 74
74 -
 75
75 -
 76
76 -
 77
77 -
 78
78 -
 79
79 -
 80
80 -
 81
81 -
 82
82 -
83
-
84
-
85
-
86
-
87
-
88
-
89
-
90
-
91
-
92
-
93
-
94
-
95
-
96
-
97
-
98
-
99
-
100
-
101
-
102
-
103
-
104
-
105
-
106
-
107
-
108
-
109
-
110
-
111
-
112
-
113
-
114
-
115
-
116
-
117
-
118
-
119
-
120
-
121
-
122
-
123
-
124
-
125
-
126
-
127
-
128
-
129
-
130
-
131
-
132
-
133
-
134
-
135
-
136
-
137
-
138
-
139
-
140
-
141
-
142
-
143
-
144
-
145
-
146
-
147
-
148
-
149
-
150
-
151
-
152
-
153
-
154
-
155
-
156
-
157
-
158
-
159
-
160
-
161
-
162
-
163
-
164
-
165
-
166
-
167
-
168
-
169
-
170
-
171
-
172
-
173
-
174
-
175
-
176
-
177
-
178
-
179
-
180
-
181
-
182
-
183
-
184
-
185
-
186
-
187
-
188
-
189
-
190
-
191
-
192
-
193
-
194
-
195
-
196
-
197
-
198
-
199
-
200
-
201
-
202
-
203
-
204
-
205
-
206
-
207
-
208
-
209
-
210
-
211
-
212
-
213
-
214
-
215
-
216
-
217
-
218
-
219
-
220
 |
 |

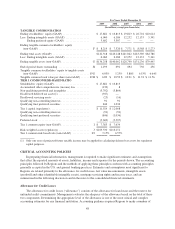
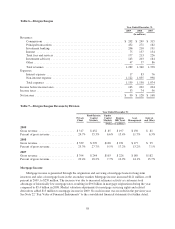
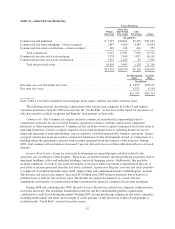
Table 6—Morgan Keegan
Year Ended December 31
2009 2008 2007
(In millions)
Revenues:
Commissions ..................................................... $ 202 $ 249 $ 315
Principal transactions ............................................... 432 271 182
Investment banking ................................................ 206 210 191
Interest .......................................................... 75 157 154
Trust fees and services .............................................. 177 213 226
Investment advisory ................................................ 143 203 184
Other ............................................................ 47 37 86
Total revenues .................................................... 1,282 1,340 1,338
Expenses:
Interest expense ................................................... 17 83 76
Non-interest expense ............................................... 1,122 1,055 998
Total expenses .................................................... 1,139 1,138 1,074
Income before income taxes .............................................. 143 202 264
Income taxes .......................................................... 53 74 96
Net income ........................................................... $ 90 $ 128 $ 168
Table 7—Morgan Keegan Revenue by Division
Year Ended December 31
Private
Client
Fixed-Income
Capital
Markets
Equity
Capital
Markets
Regions
MK Trust
Asset
Management
Interest
and Other
(Dollars in millions)
2009
Gross revenue ........................ $317 $452 $ 85 $197 $150 $ 81
Percent of gross revenue ................ 24.7% 35.3% 6.6% 15.4% 11.7% 6.3%
2008
Gross revenue ........................ $339 $370 $128 $ 231 $ 177 $ 95
Percent of gross revenue ................ 25.3% 27.7% 9.5% 17.2% 13.2% 7.1%
2007
Gross revenue ........................ $394 $244 $103 $ 226 $ 189 $ 182
Percent of gross revenue ................ 29.4% 18.2% 7.7% 16.9% 14.1% 13.7%
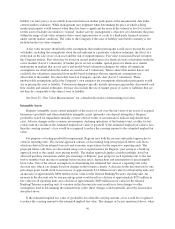
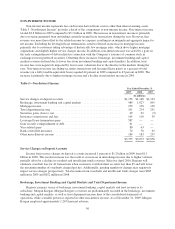
Mortgage Income
Mortgage income is generated through the origination and servicing of mortgage loans for long-term
investors and sales of mortgage loans in the secondary market. Mortgage income increased $121 million, or 88
percent in 2009, to $259 million. The increase was due to increased refinance activity as customers took
advantage of historically low mortgage rates, resulting in $9.6 billion in mortgage originations during the year,
compared to $5.4 billion in 2008. Market valuation adjustments for mortgage servicing rights and related
derivatives added $13 million to mortgage income in 2009. No such income was recorded in the previous year.
See Note 22 “Fair Value of Financial Instruments” to the consolidated financial statements for further detail.
58