Regions Bank 2009 Annual Report Download - page 121
Download and view the complete annual report
Please find page 121 of the 2009 Regions Bank annual report below. You can navigate through the pages in the report by either clicking on the pages listed below, or by using the keyword search tool below to find specific information within the annual report.-
 1
1 -
2
-
3
-
4
-
5
-
6
-
7
-
8
-
9
-
10
-
11
-
12
-
13
-
14
-
15
-
16
-
17
-
18
-
19
-
20
-
21
-
22
-
23
-
24
-
25
-
26
-
27
-
28
-
29
-
30
-
31
-
32
-
33
-
34
-
35
-
36
-
37
-
38
-
39
-
40
-
41
-
42
-
43
-
44
-
45
-
46
-
47
-
48
-
49
-
50
-
51
-
52
-
53
-
54
-
55
-
56
-
57
-
58
-
59
-
60
-
61
-
62
-
63
-
64
-
65
-
66
-
67
-
68
-
69
-
70
-
71
-
72
-
73
-
74
-
75
-
76
-
77
-
78
-
79
-
80
-
81
-
82
-
83
-
84
-
85
-
86
-
87
-
88
-
89
-
90
-
91
-
92
-
93
-
94
-
95
-
96
-
97
-
98
-
99
-
100
-
101
-
102
-
103
-
104
-
105
-
106
-
107
-
108
-
109
-
110
-
 111
111 -
 112
112 -
 113
113 -
 114
114 -
 115
115 -
 116
116 -
 117
117 -
 118
118 -
 119
119 -
 120
120 -
 121
121 -
 122
122 -
 123
123 -
 124
124 -
 125
125 -
 126
126 -
 127
127 -
 128
128 -
 129
129 -
 130
130 -
 131
131 -
132
-
133
-
134
-
135
-
136
-
137
-
138
-
139
-
140
-
141
-
142
-
143
-
144
-
145
-
146
-
147
-
148
-
149
-
150
-
151
-
152
-
153
-
154
-
155
-
156
-
157
-
158
-
159
-
160
-
161
-
162
-
163
-
164
-
165
-
166
-
167
-
168
-
169
-
170
-
171
-
172
-
173
-
174
-
175
-
176
-
177
-
178
-
179
-
180
-
181
-
182
-
183
-
184
-
185
-
186
-
187
-
188
-
189
-
190
-
191
-
192
-
193
-
194
-
195
-
196
-
197
-
198
-
199
-
200
-
201
-
202
-
203
-
204
-
205
-
206
-
207
-
208
-
209
-
210
-
211
-
212
-
213
-
214
-
215
-
216
-
217
-
218
-
219
-
220
 |
 |
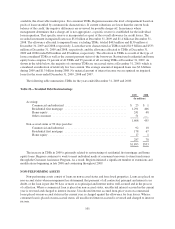
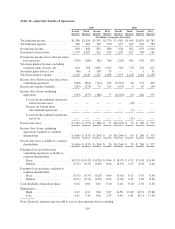
During the first quarter of 2007, Regions sold its non-conforming mortgage origination subsidiary,
EquiFirst, for a sales price of approximately $76 million and recorded an after-tax gain of approximately $1
million at the time of the sale. The sale was subject to adjustment and was finalized during 2008 resulting in
approximately $10 million of additional after-tax expense to Regions. See Note 4 “Discontinued Operations” to
the consolidated financial statements for further detail. During the third quarter of 2007, Regions also exited the
wholesale mortgage warehouse lending business as a result of risk and return considerations.
Regions reported net gains of $92 million from the sale of securities available for sale in 2008, compared to
net losses of $9 million in 2007. The 2008 net gains were primarily related to the sale of federal agency
debentures and U.S. treasury securities in the first quarter of 2008. The 2007 losses were primarily related to the
sale of federal agency securities in conjunction with balance sheet management activities.
Other income decreased 29 percent from $259 million in 2007 to $183 million in 2008. A significant driver
of the decline is due to a $26 million decrease in gains on the sale of loans in 2008 and a $21 million increase in
losses related to affordable housing investments. In addition, in 2007 Regions recognized a $9 million gain on
the termination of Union Planters hybrid debt and a $13 million gain on disposal of residual interests in an
acquired subsidiary.
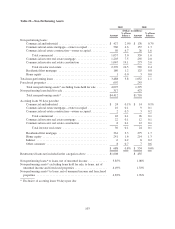
Total non-interest expense for 2008 included a $6.0 billion non-cash goodwill impairment charge.
Non-interest expense, excluding the merger-related and goodwill impairment charges, increased $282 million to
$4.6 billion in 2008. Included in non-interest expense are pre-tax merger-related charges of $201 million in 2008
and $351 million in 2007. See Table 9 “Non-Interest Expense (including Non-GAAP reconciliation)” for further
details.
Salaries and employee benefits decreased 5 percent to $2.4 billion in 2008 compared to $2.5 billion in 2007,
The decline in salaries and employee benefits is the result of ongoing merger-related and other personnel-related
efficiencies, evidenced by reductions in headcount. Included in total salaries and employee benefits are merger
charges totaling $134 million in 2008 and $159 million in 2007.
Net occupancy expense increased 7 percent to $442 million in 2008, due primarily to new branches and
rising price levels. Included in net occupancy expense were merger charges of $4 million in 2008 and $34 million
in 2007, reflecting costs to vacate leases due to the merger.
Furniture and equipment expense increased $34 million to $335 million in 2008. This increase was due to
increased depreciation and maintenance expenses associated with capital additions, including new branches
opened in 2007 and 2008. Included in furniture and equipment expense were merger charges of $5 million in
both 2008 and 2007.
Professional and legal fees totaled $214 million in 2008 compared to $152 million in 2007. Included in
professional fees during 2008 and 2007 were $7 million and $34 million, respectively, of merger-related charges.
The 2008 increase is primarily due to higher legal expenses incurred at Morgan Keegan.
Other real-estate expenses increased $87 million to $103 million in 2008 compared to $16 million in 2007,
driven by steep valuation declines and losses on the sale of foreclosed properties resulting from continued decline
of the housing market. Another contribution factor was increased costs related to operating and maintaining the
foreclosed properties during the holding period.
Marketing expenses totaled $97 million in 2008 compared to $134 million in 2007. Included in marketing
expenses were merger-related charges of $13 million in 2008 and $43 million in 2007. In 2007, marketing
expense was higher due to post-merger rebranding initiatives and marketing campaigns which ran to coincide
with branch conversions, as well as customer communications associated with branch conversions and
consolidations.
107