Regions Bank 2009 Annual Report Download - page 79
Download and view the complete annual report
Please find page 79 of the 2009 Regions Bank annual report below. You can navigate through the pages in the report by either clicking on the pages listed below, or by using the keyword search tool below to find specific information within the annual report.-
 1
1 -
2
-
3
-
4
-
5
-
6
-
7
-
8
-
9
-
10
-
11
-
12
-
13
-
14
-
15
-
16
-
17
-
18
-
19
-
20
-
21
-
22
-
23
-
24
-
25
-
26
-
27
-
28
-
29
-
30
-
31
-
32
-
33
-
34
-
35
-
36
-
37
-
38
-
39
-
40
-
41
-
42
-
43
-
44
-
45
-
46
-
47
-
48
-
49
-
50
-
51
-
52
-
53
-
54
-
55
-
56
-
57
-
58
-
59
-
60
-
61
-
62
-
63
-
64
-
65
-
66
-
67
-
68
-
 69
69 -
 70
70 -
 71
71 -
 72
72 -
 73
73 -
 74
74 -
 75
75 -
 76
76 -
 77
77 -
 78
78 -
 79
79 -
 80
80 -
 81
81 -
 82
82 -
 83
83 -
 84
84 -
 85
85 -
 86
86 -
 87
87 -
 88
88 -
 89
89 -
90
-
91
-
92
-
93
-
94
-
95
-
96
-
97
-
98
-
99
-
100
-
101
-
102
-
103
-
104
-
105
-
106
-
107
-
108
-
109
-
110
-
111
-
112
-
113
-
114
-
115
-
116
-
117
-
118
-
119
-
120
-
121
-
122
-
123
-
124
-
125
-
126
-
127
-
128
-
129
-
130
-
131
-
132
-
133
-
134
-
135
-
136
-
137
-
138
-
139
-
140
-
141
-
142
-
143
-
144
-
145
-
146
-
147
-
148
-
149
-
150
-
151
-
152
-
153
-
154
-
155
-
156
-
157
-
158
-
159
-
160
-
161
-
162
-
163
-
164
-
165
-
166
-
167
-
168
-
169
-
170
-
171
-
172
-
173
-
174
-
175
-
176
-
177
-
178
-
179
-
180
-
181
-
182
-
183
-
184
-
185
-
186
-
187
-
188
-
189
-
190
-
191
-
192
-
193
-
194
-
195
-
196
-
197
-
198
-
199
-
200
-
201
-
202
-
203
-
204
-
205
-
206
-
207
-
208
-
209
-
210
-
211
-
212
-
213
-
214
-
215
-
216
-
217
-
218
-
219
-
220
 |
 |
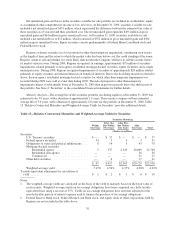
It should also be noted that only a small portion of the deferred tax assets relating to tax credit carryover has
been recognized for tax purposes, which impose a 20 year expiration date by the operation of the U.S. tax law.
Almost all of the gross deferred tax asset is produced by timing differences between GAAP and taxable income,
a significant portion of which relates to allowance for loan losses. This portion of the gross deferred tax asset
relates to items that have not yet reduced taxable income and therefore, does not have a set expiration as of
December 31, 2009.
However, management believes that a portion of its state net operating loss carryforwards will not be
realized. Accordingly, a valuation allowance has been established in the amount of $23 million against such
benefits in both 2009 and 2008.
Regions and its subsidiaries file income tax returns in the United States, as well as in various state
jurisdictions. As the successor of acquired taxpayers, Regions is responsible for the resolution of audits from
both federal and state taxing authorities. In December 2008, the Company reached an agreement with the Internal
Revenue Service Appeals Division on the Federal tax treatment of a broad range of uncertain tax positions. The
agreement covered the Federal tax returns of Regions Financial Corporation, Union Planters Corporation and
AmSouth Bancorporation for tax years 1999-2006. With a few exceptions in certain state jurisdictions, the
Company is no longer subject to state and local income tax examinations by taxing authorities for years before
2003, which would include audits of acquired entities. Certain states have proposed various adjustments to the
Company’s previously filed tax returns. Management is currently evaluating those proposed adjustments;
however, the Company does not anticipate the adjustments would result in a material change to its financial
position or results of operations.
As of December 31, 2009 and December 31, 2008, the liability for gross unrecognized tax benefits was
approximately $26 million and $55 million, respectively. Of the Company’s liability for gross unrecognized tax
benefits as of December 31, 2009, essentially all of the approximately $26 million would reduce the Company’s
effective tax rate, if recognized. As of December 31, 2009, Regions recognized a liability for interest on
uncertain tax positions of approximately $5 million for interest, on a pre-tax basis, as compared to $31 million in
2008. Additionally, during the year ended December 31, 2009, Regions recognized interest expense on uncertain
tax positions, on a pre-tax basis, on uncertain tax positions of approximately $5 million as compared to $39
million in 2008.
See Note 1 “Summary of Significant Accounting Policies” and Note 20 “Income Taxes” to the consolidated
financial statements for additional information about income taxes.
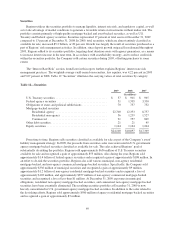
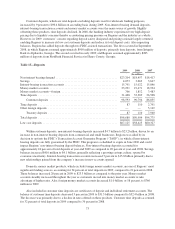
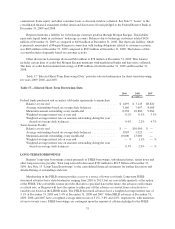
BALANCE SHEET ANALYSIS
At December 31, 2009, Regions reported total assets of $142.3 billion compared to $146.2 billion at the end
of 2008, a decrease of approximately $3.9 billion or 3 percent. The balance sheet decline reflects a decrease in
loans outstanding, primarily commercial and investor real estate balances, as well as a decrease in interest-
bearing deposits in other banks. Offsetting these decreases were increases in securities available for sale. Due to
continued lower loan demand, combined with liquidity available to the Company, Regions’ earning assets shifted
to a heavier focus on investment securities. Securities available for sale represented 19.1% of earning assets at
December 31, 2009, as compared to 14.7% at December 31, 2008.
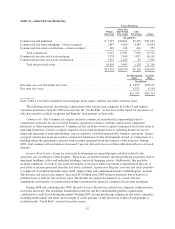
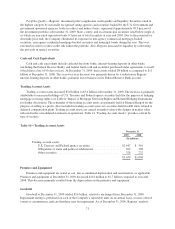
Loans
Average loans, net of unearned income, represented 75 percent of average interest-earning assets for the
year ended December 31, 2009 compared to 81 percent of average interest-earning assets for the year ended
December 31, 2008. Lending at Regions is generally organized along three functional lines: commercial and
industrial loans (including financial and agricultural, and owner occupied mortgage and construction loans),
investor real estate loans (commercial real estate mortgage and construction loans) and consumer loans
(residential first mortgage, home equity, indirect and other consumer loans). The composition of the portfolio by
these major categories is presented in Table 10 “Loan Portfolio.”
65