Regions Bank 2009 Annual Report Download - page 110
Download and view the complete annual report
Please find page 110 of the 2009 Regions Bank annual report below. You can navigate through the pages in the report by either clicking on the pages listed below, or by using the keyword search tool below to find specific information within the annual report.-
 1
1 -
2
-
3
-
4
-
5
-
6
-
7
-
8
-
9
-
10
-
11
-
12
-
13
-
14
-
15
-
16
-
17
-
18
-
19
-
20
-
21
-
22
-
23
-
24
-
25
-
26
-
27
-
28
-
29
-
30
-
31
-
32
-
33
-
34
-
35
-
36
-
37
-
38
-
39
-
40
-
41
-
42
-
43
-
44
-
45
-
46
-
47
-
48
-
49
-
50
-
51
-
52
-
53
-
54
-
55
-
56
-
57
-
58
-
59
-
60
-
61
-
62
-
63
-
64
-
65
-
66
-
67
-
68
-
69
-
70
-
71
-
72
-
73
-
74
-
75
-
76
-
77
-
78
-
79
-
80
-
81
-
82
-
83
-
84
-
85
-
86
-
87
-
88
-
89
-
90
-
91
-
92
-
93
-
94
-
95
-
96
-
97
-
98
-
99
-
 100
100 -
 101
101 -
 102
102 -
 103
103 -
 104
104 -
 105
105 -
 106
106 -
 107
107 -
 108
108 -
 109
109 -
 110
110 -
 111
111 -
 112
112 -
 113
113 -
 114
114 -
 115
115 -
 116
116 -
 117
117 -
 118
118 -
 119
119 -
 120
120 -
121
-
122
-
123
-
124
-
125
-
126
-
127
-
128
-
129
-
130
-
131
-
132
-
133
-
134
-
135
-
136
-
137
-
138
-
139
-
140
-
141
-
142
-
143
-
144
-
145
-
146
-
147
-
148
-
149
-
150
-
151
-
152
-
153
-
154
-
155
-
156
-
157
-
158
-
159
-
160
-
161
-
162
-
163
-
164
-
165
-
166
-
167
-
168
-
169
-
170
-
171
-
172
-
173
-
174
-
175
-
176
-
177
-
178
-
179
-
180
-
181
-
182
-
183
-
184
-
185
-
186
-
187
-
188
-
189
-
190
-
191
-
192
-
193
-
194
-
195
-
196
-
197
-
198
-
199
-
200
-
201
-
202
-
203
-
204
-
205
-
206
-
207
-
208
-
209
-
210
-
211
-
212
-
213
-
214
-
215
-
216
-
217
-
218
-
219
-
220
 |
 |
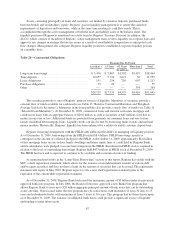
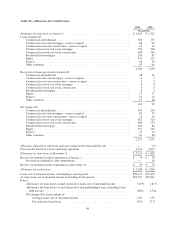
Allowance Process—Factors considered by management in determining the adequacy of the allowance
include, but are not limited to: (1) detailed reviews of individual loans; (2) historical and current trends in gross
and net loan charge-offs for the various portfolio segments evaluated; (3) the Company’s policies relating to
delinquent loans and charge-offs; (4) the level of the allowance in relation to total loans and to historical loss
levels; (5) levels and trends in non-performing and past due loans; (6) collateral values of properties securing
loans; (7) the composition of the loan portfolio, including unfunded credit commitments; (8) management’s
analysis of current economic conditions; and (9) migration of loans between risk rating categories.
In support of collateral values, Regions obtains updated valuations for non-performing loans on at least an
annual basis. For non-performing loans deemed to be in markets of concern (currently defined in general as
Florida, Georgia, North Carolina and South Carolina), Regions obtains updated valuations on a semi-annual
basis.
Credit Review, Commercial and Consumer Credit Risk Management, and Special Assets are all involved in
the credit risk management process to assess the accuracy of risk ratings, the quality of the portfolio and the
estimation of inherent credit losses in the loan portfolio. This comprehensive process also assists in the prompt
identification of problem credits. The Company has taken a number of measures to manage the portfolios and
mitigate losses, particularly in the more problematic portfolios. In addition, a strong Customer Assistance
Program is in place which educates customers about options and initiates early contact with customers to discuss
solutions when a loan first becomes delinquent.
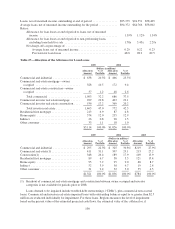
For the majority of the loan portfolio, management uses information from its ongoing review processes to
stratify the loan portfolio into pools sharing common risk characteristics. Loans that share common risk
characteristics are assigned a portion of the allowance for credit losses based on the assessment process described
above. Credit exposures are categorized by type and assigned estimated amounts of inherent loss based on
several factors, including current and historical loss experience for each pool and management’s judgment of
current economic conditions and their expected impact on credit performance.
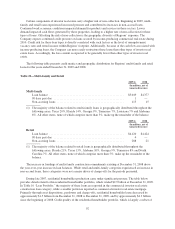
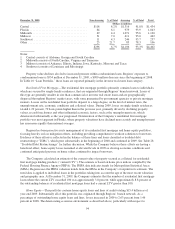
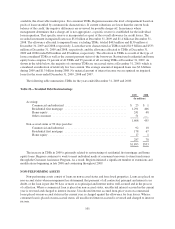
At December 31, 2009, the allowance for loan losses totaled $3.1 billion or 3.43 percent of total loans, net
of unearned income compared to $1.8 billion or 1.87 percent at year-end 2008. The increase in the allowance for
loan loss ratio reflects management’s estimate of the level of inherent losses in the portfolio, which continued to
increase during 2009 due to a recessionary economy, rising unemployment, a weakened housing market and
deterioration in income-producing properties. The increase in non-performing assets, driven by residential
homebuilder loans and income producing commercial investor real estate loans, was a key determining dynamic
in the assessment of inherent losses and, as a result, was an important factor in determining the allowance level.
Additionally, unfavorable migration between risk rating categories drove higher reserve allocation rates for these
loan portfolios.
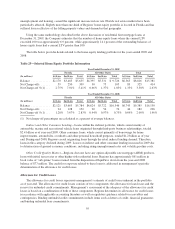
Deterioration of the Company’s home equity and residential first mortgage portfolios, especially Florida-
based credits, was also a factor in the increase in the level of allowance for loan losses. Allowance allocation
rates were increased, reflective of the increased loan losses and deteriorating delinquency trends which have been
caused by continued weakness in the housing markets, falling home equity values, and rising unemployment.
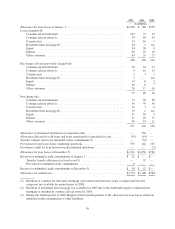
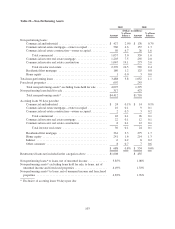
Non-performing assets increased from $1.7 billion at December 31, 2008 to $4.4 billion at December 31,
2009, which contributed to the increase in the level of allowance for loan losses. Excluding loans held for sale,
non-performing assets increased $2.8 billion to $4.1 billion at December 31, 2009.
Higher levels of charge-offs in 2009 as described below were also a factor in increasing the allowance for
loan losses. Net charge-offs as a percentage of average loans were 2.38 percent and 1.59 percent in 2009 and
2008, respectively. Charge-off ratios were higher across most major categories, with a large portion of the year-
over-year increase in net charge-offs driven by commercial investor real estate mortgage valuation losses.
Residential first mortgage loan and home equity lending charge-offs also contributed to the increase.
96