Regions Bank 2009 Annual Report Download - page 148
Download and view the complete annual report
Please find page 148 of the 2009 Regions Bank annual report below. You can navigate through the pages in the report by either clicking on the pages listed below, or by using the keyword search tool below to find specific information within the annual report.-
 1
1 -
2
-
3
-
4
-
5
-
6
-
7
-
8
-
9
-
10
-
11
-
12
-
13
-
14
-
15
-
16
-
17
-
18
-
19
-
20
-
21
-
22
-
23
-
24
-
25
-
26
-
27
-
28
-
29
-
30
-
31
-
32
-
33
-
34
-
35
-
36
-
37
-
38
-
39
-
40
-
41
-
42
-
43
-
44
-
45
-
46
-
47
-
48
-
49
-
50
-
51
-
52
-
53
-
54
-
55
-
56
-
57
-
58
-
59
-
60
-
61
-
62
-
63
-
64
-
65
-
66
-
67
-
68
-
69
-
70
-
71
-
72
-
73
-
74
-
75
-
76
-
77
-
78
-
79
-
80
-
81
-
82
-
83
-
84
-
85
-
86
-
87
-
88
-
89
-
90
-
91
-
92
-
93
-
94
-
95
-
96
-
97
-
98
-
99
-
100
-
101
-
102
-
103
-
104
-
105
-
106
-
107
-
108
-
109
-
110
-
111
-
112
-
113
-
114
-
115
-
116
-
117
-
118
-
119
-
120
-
121
-
122
-
123
-
124
-
125
-
126
-
127
-
128
-
129
-
130
-
131
-
132
-
133
-
134
-
135
-
136
-
137
-
 138
138 -
 139
139 -
 140
140 -
 141
141 -
 142
142 -
 143
143 -
 144
144 -
 145
145 -
 146
146 -
 147
147 -
 148
148 -
 149
149 -
 150
150 -
 151
151 -
 152
152 -
 153
153 -
 154
154 -
 155
155 -
 156
156 -
 157
157 -
 158
158 -
159
-
160
-
161
-
162
-
163
-
164
-
165
-
166
-
167
-
168
-
169
-
170
-
171
-
172
-
173
-
174
-
175
-
176
-
177
-
178
-
179
-
180
-
181
-
182
-
183
-
184
-
185
-
186
-
187
-
188
-
189
-
190
-
191
-
192
-
193
-
194
-
195
-
196
-
197
-
198
-
199
-
200
-
201
-
202
-
203
-
204
-
205
-
206
-
207
-
208
-
209
-
210
-
211
-
212
-
213
-
214
-
215
-
216
-
217
-
218
-
219
-
220
 |
 |

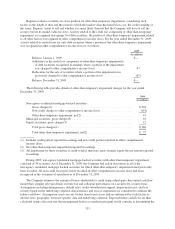
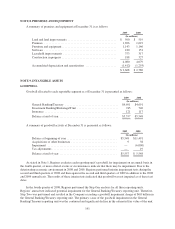
fair value. Based on the results of the estimated future cash flows, the Company determines the amount of
estimated losses related to credit and the remaining unrealized loss for which recovery is expected. Significant
weighted-average assumptions specific to non-agency residential mortgage-backed securities for which other-
than-temporary impairment was recorded during 2009 include a 22.9% collateral default rate projection, 9.2%
credit subordination support and 14.2% delinquency rate.
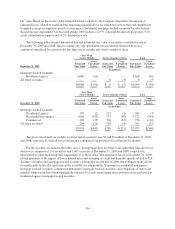
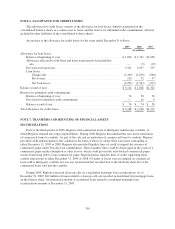
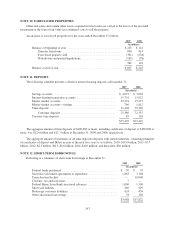
The following tables present unrealized loss and estimated fair value of securities available for sale at
December 31, 2009 and 2008. These securities are segregated between investments that have been in a
continuous unrealized loss position for less than twelve months and twelve months or more.
Less Than
Twelve Months Twelve Months or More Total
December 31, 2009
Estimated
Fair Value
Gross
Unrealized
Losses
Estimated
Fair Value
Gross
Unrealized
Losses
Estimated
Fair Value
Gross
Unrealized
Losses
(In millions)
Mortgage-backed securities:
Residential agency ............... 6,686 (61) — — 6,686 (61)
All other securities ................... — — 8 (3) 8 (3)
$6,686 $ (61) $ 8 $ (3) $6,694 $ (64)
Less Than
Twelve Months Twelve Months or More Total
December 31, 2008
Estimated
Fair Value
Gross
Unrealized
Losses
Estimated
Fair Value
Gross
Unrealized
Losses
Estimated
Fair Value
Gross
Unrealized
Losses
(In millions)
Mortgage-backed securities:
Residential agency ............... 370 (2) 212 (1) 582 (3)
Residential non-agency ........... 1,040 (345) 132 (49) 1,172 (394)
Commercial .................... 420 (75) 316 (67) 736 (142)
All other securities ................... 204 (21) 138 (4) 342 (25)
$2,034 $(443) $798 $(121) $2,832 $(564)
The gross unrealized loss on debt securities held to maturity was $0 and $1 million at December 31, 2009
and 2008, respectively, with all loss positions in a continuous loss position of less than twelve months.
For the securities included in the tables above, management does not believe any individual unrealized loss,
which was comprised of 151 securities and 1,065 securities at December 31, 2009 and 2008, respectively,
represented an other-than-temporary impairment as of those dates. The unrealized losses at December 31, 2008
related primarily to the impact of lower interest rates and widening of credit and liquidity spreads related to U.S.
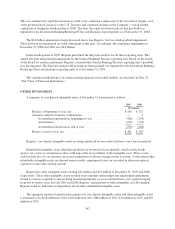
Treasury securities and mortgage-backed securities. During the second half of 2009, the Company made efforts
to significantly reduce the credit risk in the available for sale portfolio. Exposures in residential non-agency
mortgage-backed securities, commercial non-agency mortgage-backed securities, and obligations of states and
political subdivisions have been substantially reduced. Proceeds from exiting these positions were reinvested in
residential agency mortgage-backed securities.
134