Regions Bank 2009 Annual Report Download - page 150
Download and view the complete annual report
Please find page 150 of the 2009 Regions Bank annual report below. You can navigate through the pages in the report by either clicking on the pages listed below, or by using the keyword search tool below to find specific information within the annual report.-
 1
1 -
2
-
3
-
4
-
5
-
6
-
7
-
8
-
9
-
10
-
11
-
12
-
13
-
14
-
15
-
16
-
17
-
18
-
19
-
20
-
21
-
22
-
23
-
24
-
25
-
26
-
27
-
28
-
29
-
30
-
31
-
32
-
33
-
34
-
35
-
36
-
37
-
38
-
39
-
40
-
41
-
42
-
43
-
44
-
45
-
46
-
47
-
48
-
49
-
50
-
51
-
52
-
53
-
54
-
55
-
56
-
57
-
58
-
59
-
60
-
61
-
62
-
63
-
64
-
65
-
66
-
67
-
68
-
69
-
70
-
71
-
72
-
73
-
74
-
75
-
76
-
77
-
78
-
79
-
80
-
81
-
82
-
83
-
84
-
85
-
86
-
87
-
88
-
89
-
90
-
91
-
92
-
93
-
94
-
95
-
96
-
97
-
98
-
99
-
100
-
101
-
102
-
103
-
104
-
105
-
106
-
107
-
108
-
109
-
110
-
111
-
112
-
113
-
114
-
115
-
116
-
117
-
118
-
119
-
120
-
121
-
122
-
123
-
124
-
125
-
126
-
127
-
128
-
129
-
130
-
131
-
132
-
133
-
134
-
135
-
136
-
137
-
138
-
139
-
 140
140 -
 141
141 -
 142
142 -
 143
143 -
 144
144 -
 145
145 -
 146
146 -
 147
147 -
 148
148 -
 149
149 -
 150
150 -
 151
151 -
 152
152 -
 153
153 -
 154
154 -
 155
155 -
 156
156 -
 157
157 -
 158
158 -
 159
159 -
 160
160 -
161
-
162
-
163
-
164
-
165
-
166
-
167
-
168
-
169
-
170
-
171
-
172
-
173
-
174
-
175
-
176
-
177
-
178
-
179
-
180
-
181
-
182
-
183
-
184
-
185
-
186
-
187
-
188
-
189
-
190
-
191
-
192
-
193
-
194
-
195
-
196
-
197
-
198
-
199
-
200
-
201
-
202
-
203
-
204
-
205
-
206
-
207
-
208
-
209
-
210
-
211
-
212
-
213
-
214
-
215
-
216
-
217
-
218
-
219
-
220
 |
 |

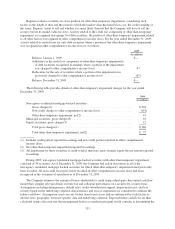
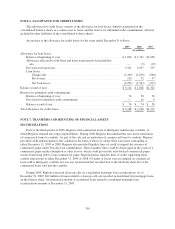
NOTE 5. LOANS
The loan portfolio at December 31 consisted of the following:
2009 2008
(In millions)
Commercial and industrial .................................................... $21,547 $23,596
Commercial real estate mortgage—owner-occupied ................................ 12,054 11,722
Commercial real estate construction—owner-occupied .............................. 751 1,605
Total commercial ........................................................ 34,352 36,923
Commercial investor real estate mortgage ........................................ 16,109 14,486
Commercial investor real estate construction ...................................... 5,591 9,029
Total investor real estate .................................................. 21,700 23,515
Residential first mortgage ..................................................... 15,632 15,839
Home equity ............................................................... 15,381 16,130
Indirect ................................................................... 2,452 3,854
Other consumer ............................................................. 1,157 1,158
Total consumer ......................................................... 34,622 36,981
$90,674 $97,419
The loan portfolio is diversified geographically, primarily within Alabama, Arkansas, Florida, Georgia,
Illinois, Indiana, Iowa, Kentucky, Louisiana, Mississippi, Missouri, North Carolina, South Carolina, Tennessee,
Texas and Virginia.
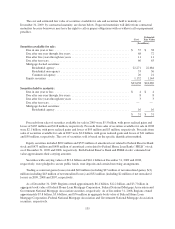
Beginning in 2008 and continuing into 2009, Regions considered its residential homebuilder, home equity
loans secured by second liens in Florida and condominium portfolios as concentrations due to the recent
pressures from economic downturns and real estate market deterioration. The residential homebuilder portfolio
was approximately $2.9 billion and $4.4 billion, respectively at December 31, 2009 and 2008, and represented
extensions of credit to real estate developers where repayment is dependent on the sale of real estate. The
majority of these loans are reported in the commercial investor real estate construction category while a smaller
portion is reported as commercial investor real estate mortgage. The portion of the home equity portfolio where
the collateral is comprised of second liens in Florida, was $3.5 billion and $3.7 billion at December 31, 2009 and
2008, respectively. The condominium portfolio was $0.6 billion and $0.9 billion at December 31, 2009 and 2008,
respectively. Beginning in the second quarter and continuing through year-end 2009, income-producing investor
real estate, including multi-family and retail, also showed signs of credit pressure. Multi-family and retail totaled
$9.2 billion at December 31, 2009 compared to $8.8 billion at December 31, 2008.
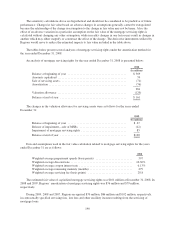
Unearned income totaled $1.1 billion and $2.1 billion at December 31, 2009 and 2008, respectively.
Included in loans, net of unearned income at December 31, 2009 and 2008, were $50 million and $107 million,
respectively, of net deferred loan costs. Unamortized net discounts on loans net of unearned income totaled $18
million and $26 million at December 31, 2009 and 2008, respectively.
Included in commercial and industrial loans were $1.3 billion and $2.4 billion of rentals receivable and $1.1
billion and $2.2 billion of unearned income on leveraged leases at December 31, 2009 and 2008, respectively.
Also, estimated residuals on leveraged leases were $339 million and $481 million at December 31, 2009 and
2008, respectively. Pre-tax income from leveraged leases for the years ending December 31, 2009, 2008 and
2007 was $100 million, $67 million and $67 million, respectively. The tax effect of this income was an expense
of $72 million, $62 million and $62 million for the years ending December 31, 2009, 2008 and 2007,
respectively.
136