Regions Bank 2009 Annual Report Download - page 161
Download and view the complete annual report
Please find page 161 of the 2009 Regions Bank annual report below. You can navigate through the pages in the report by either clicking on the pages listed below, or by using the keyword search tool below to find specific information within the annual report.-
 1
1 -
2
-
3
-
4
-
5
-
6
-
7
-
8
-
9
-
10
-
11
-
12
-
13
-
14
-
15
-
16
-
17
-
18
-
19
-
20
-
21
-
22
-
23
-
24
-
25
-
26
-
27
-
28
-
29
-
30
-
31
-
32
-
33
-
34
-
35
-
36
-
37
-
38
-
39
-
40
-
41
-
42
-
43
-
44
-
45
-
46
-
47
-
48
-
49
-
50
-
51
-
52
-
53
-
54
-
55
-
56
-
57
-
58
-
59
-
60
-
61
-
62
-
63
-
64
-
65
-
66
-
67
-
68
-
69
-
70
-
71
-
72
-
73
-
74
-
75
-
76
-
77
-
78
-
79
-
80
-
81
-
82
-
83
-
84
-
85
-
86
-
87
-
88
-
89
-
90
-
91
-
92
-
93
-
94
-
95
-
96
-
97
-
98
-
99
-
100
-
101
-
102
-
103
-
104
-
105
-
106
-
107
-
108
-
109
-
110
-
111
-
112
-
113
-
114
-
115
-
116
-
117
-
118
-
119
-
120
-
121
-
122
-
123
-
124
-
125
-
126
-
127
-
128
-
129
-
130
-
131
-
132
-
133
-
134
-
135
-
136
-
137
-
138
-
139
-
140
-
141
-
142
-
143
-
144
-
145
-
146
-
147
-
148
-
149
-
150
-
 151
151 -
 152
152 -
 153
153 -
 154
154 -
 155
155 -
 156
156 -
 157
157 -
 158
158 -
 159
159 -
 160
160 -
 161
161 -
 162
162 -
 163
163 -
 164
164 -
 165
165 -
 166
166 -
 167
167 -
 168
168 -
 169
169 -
 170
170 -
 171
171 -
172
-
173
-
174
-
175
-
176
-
177
-
178
-
179
-
180
-
181
-
182
-
183
-
184
-
185
-
186
-
187
-
188
-
189
-
190
-
191
-
192
-
193
-
194
-
195
-
196
-
197
-
198
-
199
-
200
-
201
-
202
-
203
-
204
-
205
-
206
-
207
-
208
-
209
-
210
-
211
-
212
-
213
-
214
-
215
-
216
-
217
-
218
-
219
-
220
 |
 |
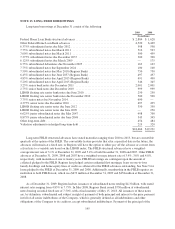
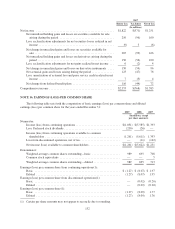
The aggregate amount of contractual maturities of all long-term debt in each of the next five years and
thereafter is as follows: 2010–$5.5 billion; 2011–$6.0 billion; 2012–$1.9 billion; 2013–$1.0 billion; 2014–$0.7
billion; and thereafter–$3.4 billion.
In May 2007, Regions filed a shelf registration statement with the U.S. Securities and Exchange
Commission. This shelf registration does not have a capacity limit and can be utilized by Regions to issue
various debt and/or equity securities. The registration statement will expire in May 2010. Regions expects to file
a new shelf registration statement prior to the expiration of the current shelf registration statement.
At December 31, 2009, Regions Bank had issued the maximum amount of $5 billion under its previously
approved Bank Note program. In July 2008, the Board of Directors approved a Bank Note program that allows
Regions Bank to issue up to $20 billion aggregate principal amount of bank notes that can be outstanding at any
one time. No issuances had been made under this program as of December 31, 2009. Notes issued under the
program may be senior notes with maturities from 30 days to 15 years and subordinated notes with maturities
from 5 years to 30 years. These notes are not deposits and they are not insured or guaranteed by the FDIC.
On October 19, 2009, the Federal Reserve Bank released a new collateral margin table for loans and
securities pledged to the discount window. These new margins significantly reduced the lendable collateral value
available to all participating banks. As a result of these margin reductions, Regions’ borrowing availability as of
December 31, 2009, based on assets available for collateral at that date, was $14.3 billion for terms of less than
29 days, or $11.5 billion with terms of greater than or equal to 29 days.
Regions may, from time to time, consider opportunistically retiring outstanding issued securities, including
subordinated debt, trust preferred securities and preferred shares in privately negotiated or open market
transactions for cash or common shares.
NOTE 14. REGULATORY CAPITAL REQUIREMENTS AND RESTRICTIONS
Regions and Regions Bank are subject to regulatory capital requirements administered by Federal banking
agencies. These regulatory capital requirements involve quantitative measures of the Company’s assets, liabilities
and certain off-balance sheet items, and also qualitative judgments by the regulators. Failure to meet minimum
capital requirements can subject the Company to a series of increasingly restrictive regulatory actions. As of
December 31, 2009 and 2008, the most recent notification from Federal banking agencies categorized Regions
and its significant subsidiaries as “well capitalized” under the regulatory framework.
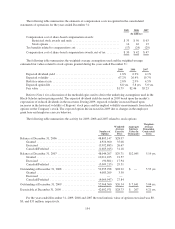
Minimum capital requirements for all banks are Tier 1 Capital of at least 4% of risk-weighted assets, Total
Capital of at least 8% of risk-weighted assets and a Leverage Ratio of 3%, plus an additional 100 to 200 basis-
point cushion in certain circumstances, of adjusted quarterly average assets. Tier 1 Capital consists principally of
stockholders’ equity, excluding accumulated other comprehensive income (loss), less goodwill, deferred tax
assets, and certain other intangibles. Total Capital consists of Tier 1 Capital plus certain debt instruments and the
allowance for credit losses, subject to limitation. The Company believes that no changes in conditions or events
have occurred since December 31, 2009, which would result in changes that would cause Regions or Regions
Bank to fall below the well capitalized level.
147