Regions Bank 2009 Annual Report Download - page 164
Download and view the complete annual report
Please find page 164 of the 2009 Regions Bank annual report below. You can navigate through the pages in the report by either clicking on the pages listed below, or by using the keyword search tool below to find specific information within the annual report.-
 1
1 -
2
-
3
-
4
-
5
-
6
-
7
-
8
-
9
-
10
-
11
-
12
-
13
-
14
-
15
-
16
-
17
-
18
-
19
-
20
-
21
-
22
-
23
-
24
-
25
-
26
-
27
-
28
-
29
-
30
-
31
-
32
-
33
-
34
-
35
-
36
-
37
-
38
-
39
-
40
-
41
-
42
-
43
-
44
-
45
-
46
-
47
-
48
-
49
-
50
-
51
-
52
-
53
-
54
-
55
-
56
-
57
-
58
-
59
-
60
-
61
-
62
-
63
-
64
-
65
-
66
-
67
-
68
-
69
-
70
-
71
-
72
-
73
-
74
-
75
-
76
-
77
-
78
-
79
-
80
-
81
-
82
-
83
-
84
-
85
-
86
-
87
-
88
-
89
-
90
-
91
-
92
-
93
-
94
-
95
-
96
-
97
-
98
-
99
-
100
-
101
-
102
-
103
-
104
-
105
-
106
-
107
-
108
-
109
-
110
-
111
-
112
-
113
-
114
-
115
-
116
-
117
-
118
-
119
-
120
-
121
-
122
-
123
-
124
-
125
-
126
-
127
-
128
-
129
-
130
-
131
-
132
-
133
-
134
-
135
-
136
-
137
-
138
-
139
-
140
-
141
-
142
-
143
-
144
-
145
-
146
-
147
-
148
-
149
-
150
-
151
-
152
-
153
-
 154
154 -
 155
155 -
 156
156 -
 157
157 -
 158
158 -
 159
159 -
 160
160 -
 161
161 -
 162
162 -
 163
163 -
 164
164 -
 165
165 -
 166
166 -
 167
167 -
 168
168 -
 169
169 -
 170
170 -
 171
171 -
 172
172 -
 173
173 -
 174
174 -
175
-
176
-
177
-
178
-
179
-
180
-
181
-
182
-
183
-
184
-
185
-
186
-
187
-
188
-
189
-
190
-
191
-
192
-
193
-
194
-
195
-
196
-
197
-
198
-
199
-
200
-
201
-
202
-
203
-
204
-
205
-
206
-
207
-
208
-
209
-
210
-
211
-
212
-
213
-
214
-
215
-
216
-
217
-
218
-
219
-
220
 |
 |
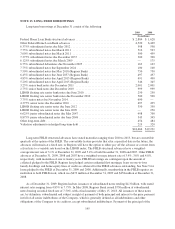
The fair value allocation of the $3.5 billion between the preferred shares and the warrant resulted in $3.304
billion allocated to the preferred shares and $196 million allocated to the warrant. Accrued dividends on the
Series A preferred shares reduced retained earnings by $175 million in 2009 and $23 million during 2008. The
unamortized discount on the preferred shares was $157 million and $193 million at December 31, 2009 and
2008, respectively. Discount accretion on the preferred shares reduced retained earnings by $36 million during
2009 and $3 million in 2008. Both the preferred securities and the warrant will be accounted for as components
of Regions’ regulatory Tier 1 Capital.
On May 20, 2009 the Company issued 287,500 shares of mandatory convertible preferred stock, Series B
(“Series B shares”), generating net proceeds of approximately $278 million. Regions will pay annual dividends at
a rate of 10% per share on the initial liquidation preference of $1,000.00 per share. Series B shares may be
converted into common shares: 1) at December 15, 2010 (the “mandatory conversion date”); 2) prior to
December 15, 2010 at the option of the holder; 3) upon occurrence of certain changes in ownership as defined in
the offering documents; or 4) prior to December 15, 2010 at the option of the Company. At the mandatory
conversion date, the Series B shares are subject to conversion into shares of Regions’ common stock with a per
share conversion rate of not more than approximately 250 shares of common stock and not less than
approximately 227 shares of common stock dependent upon the applicable market price, subject to anti-dilution
adjustments. The Series B shares are not redeemable and rank senior to common stock and to each other class of
capital stock established in the future, and on parity with the Series A preferred stock previously issued to the
U.S. Treasury. If converted at December 31, 2009, approximately 61 million shares of Regions’ common stock
would have been issued. In November 2009, a single investor converted approximately 20,000 Series B shares to
common shares as allowed under the original transaction documents. Accrued dividends on the Series B shares
reduced retained earnings by $19 million during 2009.
On May 20, 2009, the Company issued 460 million shares of common stock at $4 per share, generating
proceeds of $1.8 billion, net of issuance costs.
In addition to the offerings mentioned above, the Company also exchanged approximately 33 million
common shares for $202 million of outstanding 6.625% trust preferred securities issued by Regions Financing
Trust II (“the Trust”) in the second quarter of 2009. The trust preferred securities were exchanged for junior
subordinated notes issued by the Company to the Trust. The Company recognized a pre-tax gain of
approximately $61 million on the extinguishment of the junior subordinated notes. The increase in shareholders’
equity related to the debt for common share exchange was approximately $135 million, net of issuance costs.
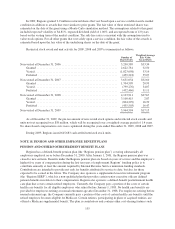
On January 18, 2007, Regions’ Board of Directors approved the repurchase of 50 million shares of the
Company’s outstanding common stock. The common shares may be repurchased in the open market or in
privately negotiated transactions and will be taken into treasury. There were no treasury stock purchases through
open market transactions during 2009 or 2008. Regions’ ability to repurchase shares is limited under the terms of
the CPP mentioned above. Regions stock maintained within trust or brokerage accounts related to Company
deferred compensation plans was recorded in treasury stock during 2009 and 2008. At December 31, 2009 and
2008, there were approximately 23.1 million shares remaining under this authorization.
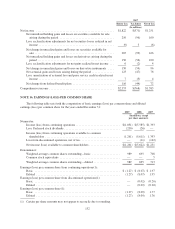
At December 31, 2009, there were 53,216,000 shares reserved for issuance under stock compensation plans.
Stock options outstanding represent 52,969,000 shares and 247,000 shares are reserved for issuance under
deferred compensation plans.
In 2009, Regions decreased its dividend to $0.13 per common share, compared to $0.96 in 2008 and $1.46
in 2007. Regions does not expect to increase its quarterly dividend above the current $0.01 for the foreseeable
future.
Comprehensive income (loss) is the total of net income (loss) and all other non-owner changes in equity.
Items that are to be recognized under accounting standards as components of comprehensive income (loss) are
displayed in the consolidated statements of changes in stockholders’ equity. In the calculation of comprehensive
150