Regions Bank 2009 Annual Report Download - page 120
Download and view the complete annual report
Please find page 120 of the 2009 Regions Bank annual report below. You can navigate through the pages in the report by either clicking on the pages listed below, or by using the keyword search tool below to find specific information within the annual report.-
 1
1 -
2
-
3
-
4
-
5
-
6
-
7
-
8
-
9
-
10
-
11
-
12
-
13
-
14
-
15
-
16
-
17
-
18
-
19
-
20
-
21
-
22
-
23
-
24
-
25
-
26
-
27
-
28
-
29
-
30
-
31
-
32
-
33
-
34
-
35
-
36
-
37
-
38
-
39
-
40
-
41
-
42
-
43
-
44
-
45
-
46
-
47
-
48
-
49
-
50
-
51
-
52
-
53
-
54
-
55
-
56
-
57
-
58
-
59
-
60
-
61
-
62
-
63
-
64
-
65
-
66
-
67
-
68
-
69
-
70
-
71
-
72
-
73
-
74
-
75
-
76
-
77
-
78
-
79
-
80
-
81
-
82
-
83
-
84
-
85
-
86
-
87
-
88
-
89
-
90
-
91
-
92
-
93
-
94
-
95
-
96
-
97
-
98
-
99
-
100
-
101
-
102
-
103
-
104
-
105
-
106
-
107
-
108
-
109
-
 110
110 -
 111
111 -
 112
112 -
 113
113 -
 114
114 -
 115
115 -
 116
116 -
 117
117 -
 118
118 -
 119
119 -
 120
120 -
 121
121 -
 122
122 -
 123
123 -
 124
124 -
 125
125 -
 126
126 -
 127
127 -
 128
128 -
 129
129 -
 130
130 -
131
-
132
-
133
-
134
-
135
-
136
-
137
-
138
-
139
-
140
-
141
-
142
-
143
-
144
-
145
-
146
-
147
-
148
-
149
-
150
-
151
-
152
-
153
-
154
-
155
-
156
-
157
-
158
-
159
-
160
-
161
-
162
-
163
-
164
-
165
-
166
-
167
-
168
-
169
-
170
-
171
-
172
-
173
-
174
-
175
-
176
-
177
-
178
-
179
-
180
-
181
-
182
-
183
-
184
-
185
-
186
-
187
-
188
-
189
-
190
-
191
-
192
-
193
-
194
-
195
-
196
-
197
-
198
-
199
-
200
-
201
-
202
-
203
-
204
-
205
-
206
-
207
-
208
-
209
-
210
-
211
-
212
-
213
-
214
-
215
-
216
-
217
-
218
-
219
-
220
 |
 |
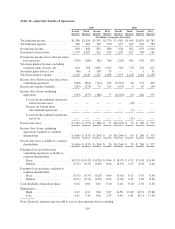
Net loss from continuing operations in 2008 was $5.6 billion, or $8.07 per diluted common share, compared
to net income from continuing operations of $1.4 billion, or $1.95 per diluted share in 2007. Regions incurred an
$18 million and a $217 million pre-tax loss related to EquiFirst resulting in an after-tax net loss of $11 million
and $142 million, for the years ended December 31, 2008 and 2007, respectively, which were accounted for as
discontinued operations. Net income in 2008 includes after-tax merger charges of $125 million, or $0.18 per
diluted share, compared to 2007 after-tax merger charges of $219 million, or $0.31 per diluted share.
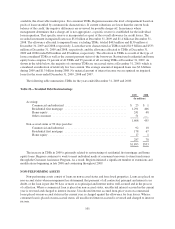
As a result of the large earnings impact from the goodwill impairment charge, return measures, such as
return on average tangible common stockholders’ equity, were not meaningful for 2008 on a generally accepted
accounting principles (“GAAP”) basis. Excluding the goodwill impairment charge, merger-related charges and
discontinued operations, return on average tangible common stockholders’ equity was 6.79 percent for the year
ended December 31, 2008, compared to 20.43 percent for 2007. See Table 2 “GAAP to Non-GAAP
Reconciliation” for additional details and Table 1 “Financial Highlights” for additional ratios.
Net interest income was $3.8 billion in 2008 compared to $4.4 billion in 2007. The decrease was driven by a
lower net interest margin, which declined from 3.79 percent in 2007 to 3.23 percent in 2008. The net interest
margin was negatively impacted by factors directly and indirectly associated with the erosion of economic and
industry conditions in late 2007 and throughout 2008. These factors included an unfavorable variation in the
general level and shape of the yield curve, intensification of price-based competition for retail deposits,
disintermediation of deposits into other non-bank asset classes, rate increases for new debt issuances and rising
non-performing asset levels. In addition, the costs of maintenance of the Company’s liquidity profile in the
stressed environment increased, further pressuring the net interest margin.
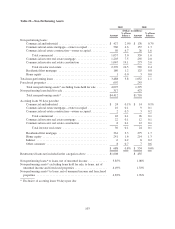
The following discussion of non-interest income and expense is from continuing operations and excludes
EquiFirst, which is reported separately as discontinued operations in the consolidated statements of operations.
Non-interest income (excluding securities gains/losses) totaled $3.0 billion, or 43 percent of total revenue (on a
fully taxable-equivalent basis) in 2008, compared to $2.9 billion, or 39 percent of total revenue (on a fully
taxable-equivalent basis) in 2007, and continued to reflect Regions’ diversified revenue stream. The increase in
non-interest income is primarily due to strong brokerage, investment banking and capital markets income,
especially during the first half of 2008. As the year progressed, however, brokerage and equity capital markets
revenue streams were affected by declining market activity and transaction flow. In addition in 2008, Regions
recorded $63 million of other income due to proceeds from a sale of Class B common stock ownership interest in
Visa.
Service charges on deposit accounts decreased 1 percent to $1.1 billion in 2008, primarily due to a decline
in consumer insufficient funds and overdraft fees, due to policy changes which were enacted to retain customers.
Brokerage, investment banking and capital markets income increased in 2008 to $1.0 billion compared to
$895 million in 2007, primarily reflecting stronger capital markets income. Despite the year-over-year increase in
revenues, results for 2008 reflect the impact of the effective closure of credit markets and general upheaval in
domestic and foreign markets. In addition, private client revenues were influenced by a reluctance of retail
investors to make investment decisions in the market, due to increasing unemployment, declining property
values, and declining personal wealth. Trust department income declined 7 percent to $234 million in 2008 from
$251 million in 2007. Trust department income was negatively impacted by a reduction in fees from less assets
under management. Customer and trust assets under management were $63.0 billion and $62.1 billion,
respectively, at year-end 2008 compared to approximately $80.0 billion and $81.0 billion, respectively, at
year-end 2007.
In 2008, mortgage income increased slightly from $136 million in 2007 to $138 million in 2008 due in part
to the recognition of $10 million in loan servicing value during the first quarter of 2008 related to the adoption of
FAS 159.
106