Regions Bank 2009 Annual Report Download - page 92
Download and view the complete annual report
Please find page 92 of the 2009 Regions Bank annual report below. You can navigate through the pages in the report by either clicking on the pages listed below, or by using the keyword search tool below to find specific information within the annual report.-
 1
1 -
2
-
3
-
4
-
5
-
6
-
7
-
8
-
9
-
10
-
11
-
12
-
13
-
14
-
15
-
16
-
17
-
18
-
19
-
20
-
21
-
22
-
23
-
24
-
25
-
26
-
27
-
28
-
29
-
30
-
31
-
32
-
33
-
34
-
35
-
36
-
37
-
38
-
39
-
40
-
41
-
42
-
43
-
44
-
45
-
46
-
47
-
48
-
49
-
50
-
51
-
52
-
53
-
54
-
55
-
56
-
57
-
58
-
59
-
60
-
61
-
62
-
63
-
64
-
65
-
66
-
67
-
68
-
69
-
70
-
71
-
72
-
73
-
74
-
75
-
76
-
77
-
78
-
79
-
80
-
81
-
 82
82 -
 83
83 -
 84
84 -
 85
85 -
 86
86 -
 87
87 -
 88
88 -
 89
89 -
 90
90 -
 91
91 -
 92
92 -
 93
93 -
 94
94 -
 95
95 -
 96
96 -
 97
97 -
 98
98 -
 99
99 -
 100
100 -
 101
101 -
 102
102 -
103
-
104
-
105
-
106
-
107
-
108
-
109
-
110
-
111
-
112
-
113
-
114
-
115
-
116
-
117
-
118
-
119
-
120
-
121
-
122
-
123
-
124
-
125
-
126
-
127
-
128
-
129
-
130
-
131
-
132
-
133
-
134
-
135
-
136
-
137
-
138
-
139
-
140
-
141
-
142
-
143
-
144
-
145
-
146
-
147
-
148
-
149
-
150
-
151
-
152
-
153
-
154
-
155
-
156
-
157
-
158
-
159
-
160
-
161
-
162
-
163
-
164
-
165
-
166
-
167
-
168
-
169
-
170
-
171
-
172
-
173
-
174
-
175
-
176
-
177
-
178
-
179
-
180
-
181
-
182
-
183
-
184
-
185
-
186
-
187
-
188
-
189
-
190
-
191
-
192
-
193
-
194
-
195
-
196
-
197
-
198
-
199
-
200
-
201
-
202
-
203
-
204
-
205
-
206
-
207
-
208
-
209
-
210
-
211
-
212
-
213
-
214
-
215
-
216
-
217
-
218
-
219
-
220
 |
 |

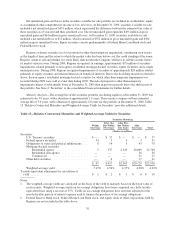
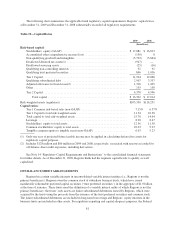
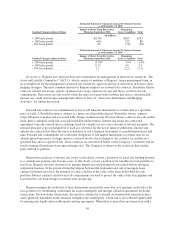
The following table indicates various ratings at December 31, 2009 and 2008.
Table 18—Credit Ratings
As of December 31, 2009
Standard
& Poor’s Moody’s Fitch DBRS
Regions Financial Corporation
Senior notes .............................................. BBB Baa3 BBB+ AL
Subordinated notes ........................................ BBB- Ba1 BBB BBBH
Junior subordinated notes ................................... BB Ba2 BBB- BBBH
Regions Bank
Short-term debt ........................................... A-2 P-2 F2 R-1L
Long-term bank deposits .................................... BBB+ Baa1 A- A
Long-term debt ........................................... BBB+ Baa1 BBB+ A
Subordinated debt ......................................... BBB Baa2 BBB AL
As of December 31, 2008
Standard
& Poor’s Moody’s Fitch DBRS
Regions Financial Corporation
Senior notes .............................................. A A2 A+ AH
Subordinated notes ........................................ A- A3 A A
Junior subordinated notes ................................... BBB+ A3 A A
Regions Bank
Short-term debt ........................................... A-1 P-1 F1+ R-1M
Long-term bank deposits .................................... A+ A1 AA- AAL
Long-term debt ........................................... A+ A1 A+ AAL
Subordinated debt ......................................... A A2 A AH
In 2009, the rating agencies downgraded the credit ratings and enacted a negative outlook on many banking
institutions, citing concerns over real estate exposure and credit losses, among others. In addition, the rating
agencies were particularly concerned with regional banks that had higher concentrations in commercial real
estate, most notably construction and land development loans. To a large extent, downgrades were reflective of
the rating agencies’ views of increasing industry risk, a worsening economic backdrop, and, specific to Regions,
its exposure to commercial real estate. During the year, Regions Financial Corporation and Regions Bank
received downgrades from each of the ratings agencies, citing concerns regarding Regions’ credit quality and the
related implication to its capital as the primary determinant of the ratings actions. Ratings may impact Regions in
several ways, including, but not limited to, its borrowing cost and capacity, collateral requirements and
acceptability of its letters of credit, as well as FDIC insurance costs.
STOCKHOLDERS’ EQUITY
Stockholders’ equity increased to $17.9 billion at year-end 2009 versus $16.8 billion at year-end 2008, with
the increase primarily generated from public offerings of common and preferred stock during the second quarter
of 2009. In 2009, net losses reduced stockholders’ equity by $1.0 billion, cash dividends declared reduced
stockholders’ equity by $105 million for common stock and $194 million for preferred stock, and changes in
accumulated other comprehensive income increased equity by $152 million.
On May 7, 2009, the final results of the Federal Reserve’s Supervisory Capital Assessment Program
(“SCAP”) were released requiring Regions to submit a capital plan to its regulators detailing the steps to be
utilized to increase total Tier 1 common equity by $2.5 billion, of which at least $0.4 billion had to be new Tier 1
equity (see Table 2 “GAAP to Non-GAAP Reconciliation” and Table 19 “Capital Ratios” for further discussion).
78