Regions Bank 2009 Annual Report Download - page 174
Download and view the complete annual report
Please find page 174 of the 2009 Regions Bank annual report below. You can navigate through the pages in the report by either clicking on the pages listed below, or by using the keyword search tool below to find specific information within the annual report.-
 1
1 -
2
-
3
-
4
-
5
-
6
-
7
-
8
-
9
-
10
-
11
-
12
-
13
-
14
-
15
-
16
-
17
-
18
-
19
-
20
-
21
-
22
-
23
-
24
-
25
-
26
-
27
-
28
-
29
-
30
-
31
-
32
-
33
-
34
-
35
-
36
-
37
-
38
-
39
-
40
-
41
-
42
-
43
-
44
-
45
-
46
-
47
-
48
-
49
-
50
-
51
-
52
-
53
-
54
-
55
-
56
-
57
-
58
-
59
-
60
-
61
-
62
-
63
-
64
-
65
-
66
-
67
-
68
-
69
-
70
-
71
-
72
-
73
-
74
-
75
-
76
-
77
-
78
-
79
-
80
-
81
-
82
-
83
-
84
-
85
-
86
-
87
-
88
-
89
-
90
-
91
-
92
-
93
-
94
-
95
-
96
-
97
-
98
-
99
-
100
-
101
-
102
-
103
-
104
-
105
-
106
-
107
-
108
-
109
-
110
-
111
-
112
-
113
-
114
-
115
-
116
-
117
-
118
-
119
-
120
-
121
-
122
-
123
-
124
-
125
-
126
-
127
-
128
-
129
-
130
-
131
-
132
-
133
-
134
-
135
-
136
-
137
-
138
-
139
-
140
-
141
-
142
-
143
-
144
-
145
-
146
-
147
-
148
-
149
-
150
-
151
-
152
-
153
-
154
-
155
-
156
-
157
-
158
-
159
-
160
-
161
-
162
-
163
-
 164
164 -
 165
165 -
 166
166 -
 167
167 -
 168
168 -
 169
169 -
 170
170 -
 171
171 -
 172
172 -
 173
173 -
 174
174 -
 175
175 -
 176
176 -
 177
177 -
 178
178 -
 179
179 -
 180
180 -
 181
181 -
 182
182 -
 183
183 -
 184
184 -
185
-
186
-
187
-
188
-
189
-
190
-
191
-
192
-
193
-
194
-
195
-
196
-
197
-
198
-
199
-
200
-
201
-
202
-
203
-
204
-
205
-
206
-
207
-
208
-
209
-
210
-
211
-
212
-
213
-
214
-
215
-
216
-
217
-
218
-
219
-
220
 |
 |

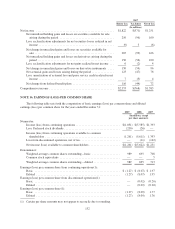
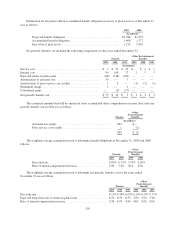
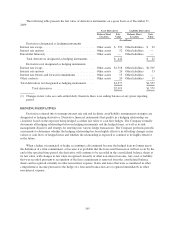
The following table illustrates a rollforward for pension plan financial assets measured at fair value on a
recurring basis using significant unobservable inputs (Level 3) for the year ended December 31, 2009 (the other
postretirement plan had no Level 3 financial assets):
Fair Value Measurements Using
Significant Unobservable Inputs
Year Ended December 31, 2009
(Level 3 measurements only)
Hedge funds
Real estate
funds
Miscellaneous
assets
(In millions)
Beginning balance, January 1, 2009 .............................. $78 $ 82 $ 1
Actual return on plan assets:
Attributable to assets sold during the reporting period ........ 2 — —
Attributable to assets held at December 31, 2009 ............ 8 (28) —
Purchases, sales, issuances, and settlements, net ................. (36) 2 1
Ending balance, December 31, 2009 .............................. $52 $ 56 $ 2
Information about the expected cash flows for the pension plan and other postretirement benefits plans is as
follows:
Pension
Other
Postretirement
Benefits
(In millions)
Expected Employer Contributions:
2010 ................................................. $ 38 $ 4
Expected Benefit Payments:
2010 ................................................. $107 $ 5
2011 ................................................. 80 5
2012 ................................................. 83 4
2013 ................................................. 88 4
2014 ................................................. 96 3
2015-2019 ............................................. 540 12
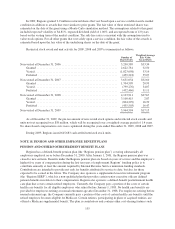
OTHER PLANS
Regions has a defined-contribution 401(k) plan that historically included a company match of eligible
employee contributions. Through March 31, 2009, this match totaled 100% of the eligible employee pre-tax
contribution (up to 6% of compensation) after one year of service and was initially invested in Regions common
stock. Matching contributions in the 401(k) plan were temporarily suspended beginning in the second quarter of
2009. Effective January 1, 2010, Regions restored matching contributions to the 401(k) plan to the pre-existing
levels. Regions’ contribution to the 401(k) plan on behalf of employees totaled $18 million, $55 million and $72
million in 2009, 2008 and 2007, respectively. Regions’ 401(k) plan held 24 million and 17 million shares of
Regions common stock at December 31, 2009 and 2008, respectively. For the years ended December 31, 2009,
2008 and 2007, the 401(k) plan received $5 million, $12 million and $20 million, respectively, in dividends on
Regions common stock. Regions also assumed the AmSouth 401(k) plan as a result of the merger. Effective
April 1, 2008, the Regions and AmSouth 401(k) plans were merged into one plan.
160