Regions Bank 2009 Annual Report Download - page 118
Download and view the complete annual report
Please find page 118 of the 2009 Regions Bank annual report below. You can navigate through the pages in the report by either clicking on the pages listed below, or by using the keyword search tool below to find specific information within the annual report.-
 1
1 -
2
-
3
-
4
-
5
-
6
-
7
-
8
-
9
-
10
-
11
-
12
-
13
-
14
-
15
-
16
-
17
-
18
-
19
-
20
-
21
-
22
-
23
-
24
-
25
-
26
-
27
-
28
-
29
-
30
-
31
-
32
-
33
-
34
-
35
-
36
-
37
-
38
-
39
-
40
-
41
-
42
-
43
-
44
-
45
-
46
-
47
-
48
-
49
-
50
-
51
-
52
-
53
-
54
-
55
-
56
-
57
-
58
-
59
-
60
-
61
-
62
-
63
-
64
-
65
-
66
-
67
-
68
-
69
-
70
-
71
-
72
-
73
-
74
-
75
-
76
-
77
-
78
-
79
-
80
-
81
-
82
-
83
-
84
-
85
-
86
-
87
-
88
-
89
-
90
-
91
-
92
-
93
-
94
-
95
-
96
-
97
-
98
-
99
-
100
-
101
-
102
-
103
-
104
-
105
-
106
-
107
-
 108
108 -
 109
109 -
 110
110 -
 111
111 -
 112
112 -
 113
113 -
 114
114 -
 115
115 -
 116
116 -
 117
117 -
 118
118 -
 119
119 -
 120
120 -
 121
121 -
 122
122 -
 123
123 -
 124
124 -
 125
125 -
 126
126 -
 127
127 -
 128
128 -
129
-
130
-
131
-
132
-
133
-
134
-
135
-
136
-
137
-
138
-
139
-
140
-
141
-
142
-
143
-
144
-
145
-
146
-
147
-
148
-
149
-
150
-
151
-
152
-
153
-
154
-
155
-
156
-
157
-
158
-
159
-
160
-
161
-
162
-
163
-
164
-
165
-
166
-
167
-
168
-
169
-
170
-
171
-
172
-
173
-
174
-
175
-
176
-
177
-
178
-
179
-
180
-
181
-
182
-
183
-
184
-
185
-
186
-
187
-
188
-
189
-
190
-
191
-
192
-
193
-
194
-
195
-
196
-
197
-
198
-
199
-
200
-
201
-
202
-
203
-
204
-
205
-
206
-
207
-
208
-
209
-
210
-
211
-
212
-
213
-
214
-
215
-
216
-
217
-
218
-
219
-
220
 |
 |

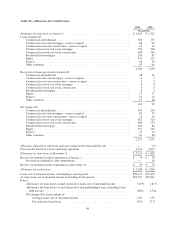
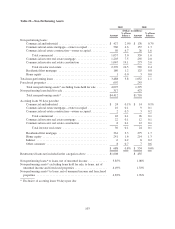
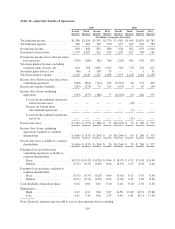
2007 2006 2005
(In millions)
Non-performing loans:
Commercial and industrial .............................................. $ 92 $ 57 $ n/a
Commercial real estate(1) .............................................. 263 128 n/a
Construction(1) ....................................................... 310 57 n/a
Residential first mortgage .............................................. 72 54 n/a
Home equity ......................................................... 7 10 n/a
Total non-performing loans ................................................. 744 306 341
Foreclosed properties ...................................................... 120 73 66
Total non-performing assets* ............................................ $864 $379 $407
Non-performing loans* to loans, net of unearned income .......................... 0.78% 0.32% 0.58%
Non-performing assets* excluding loans held for sale, to loans, net of unearned income
and foreclosed properties ................................................. 0.90% 0.40% 0.70%
Non-performing assets* to loans, net of unearned income and foreclosed properties .... 0.90% 0.40% 0.70%
Accruing loans 90 days past due:
Commercial and industrial .............................................. $ 12 $ 10 $ n/a
Commercial real estate(1) .............................................. 12 26 n/a
Construction(1) ....................................................... 19 15 n/a
Residential first mortgage .............................................. 155 44 n/a
Home equity ......................................................... 147 41 n/a
Indirect ............................................................. 6 3 n/a
Other consumer ...................................................... 6 5 n/a
$ 357 $ 144 $ 88
* Exclusive of accruing loans 90 days past due
Note: Non-accrual loans and accruing loans 90 days past due by loan category are not available for periods prior
to 2006.
(1) Breakout of commercial real estate mortgage and construction between owner occupied and investor
categories not available for periods prior to 2008.
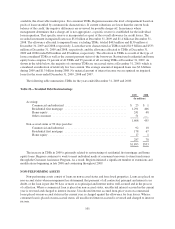
Loans past due 90 days or more and still accruing totaled $688 million as of year-end 2009, an increase of
$134 million from year-end 2008 levels, and reflected weaker economic conditions and general market
deterioration. The increase was primarily due to increases in home equity and residential first mortgages,
particularly in Florida.
At December 31, 2009 and December 31, 2008, Regions had approximately $1.2 billion and $0.8 billion,
respectively, of potential problem commercial and investor real estate loans that were not included in non-accrual
loans or in the accruing loans 90 days past due categories, but for which management had concerns as to the
ability of such borrowers to comply with their present loan repayment terms. At December 31, 2009, $13 million
of the $813 million from 2008 remained categorized as potential problem loans. The remaining loans either
migrated to non-performing status or were no longer considered potential problem loans.
FINANCIAL DISCLOSURE AND INTERNAL CONTROLS
Regions has always maintained internal controls over financial reporting, which generally include those
controls relating to the preparation of the consolidated financial statements in conformity with accounting
principles generally accepted in the U.S. Regions’ process for evaluating internal controls over financial
reporting starts with understanding the risks facing each of its functions and areas; how those risks are controlled
or mitigated; and how management monitors those controls to ensure that they are in place and effective. These
104