Regions Bank 2009 Annual Report Download - page 77
Download and view the complete annual report
Please find page 77 of the 2009 Regions Bank annual report below. You can navigate through the pages in the report by either clicking on the pages listed below, or by using the keyword search tool below to find specific information within the annual report.-
 1
1 -
2
-
3
-
4
-
5
-
6
-
7
-
8
-
9
-
10
-
11
-
12
-
13
-
14
-
15
-
16
-
17
-
18
-
19
-
20
-
21
-
22
-
23
-
24
-
25
-
26
-
27
-
28
-
29
-
30
-
31
-
32
-
33
-
34
-
35
-
36
-
37
-
38
-
39
-
40
-
41
-
42
-
43
-
44
-
45
-
46
-
47
-
48
-
49
-
50
-
51
-
52
-
53
-
54
-
55
-
56
-
57
-
58
-
59
-
60
-
61
-
62
-
63
-
64
-
65
-
66
-
 67
67 -
 68
68 -
 69
69 -
 70
70 -
 71
71 -
 72
72 -
 73
73 -
 74
74 -
 75
75 -
 76
76 -
 77
77 -
 78
78 -
 79
79 -
 80
80 -
 81
81 -
 82
82 -
 83
83 -
 84
84 -
 85
85 -
 86
86 -
 87
87 -
88
-
89
-
90
-
91
-
92
-
93
-
94
-
95
-
96
-
97
-
98
-
99
-
100
-
101
-
102
-
103
-
104
-
105
-
106
-
107
-
108
-
109
-
110
-
111
-
112
-
113
-
114
-
115
-
116
-
117
-
118
-
119
-
120
-
121
-
122
-
123
-
124
-
125
-
126
-
127
-
128
-
129
-
130
-
131
-
132
-
133
-
134
-
135
-
136
-
137
-
138
-
139
-
140
-
141
-
142
-
143
-
144
-
145
-
146
-
147
-
148
-
149
-
150
-
151
-
152
-
153
-
154
-
155
-
156
-
157
-
158
-
159
-
160
-
161
-
162
-
163
-
164
-
165
-
166
-
167
-
168
-
169
-
170
-
171
-
172
-
173
-
174
-
175
-
176
-
177
-
178
-
179
-
180
-
181
-
182
-
183
-
184
-
185
-
186
-
187
-
188
-
189
-
190
-
191
-
192
-
193
-
194
-
195
-
196
-
197
-
198
-
199
-
200
-
201
-
202
-
203
-
204
-
205
-
206
-
207
-
208
-
209
-
210
-
211
-
212
-
213
-
214
-
215
-
216
-
217
-
218
-
219
-
220
 |
 |
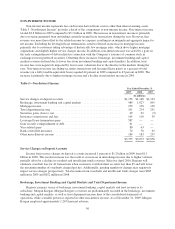
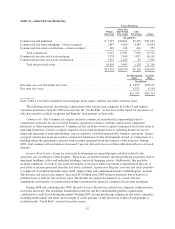
Amortization of Core Deposit Intangibles
The premium paid for core deposits in an acquisition is considered to be an intangible asset that is amortized
on an accelerated basis over its useful life. As a result, amortization of core deposit intangibles decreased 10
percent to $120 million in 2009 compared to $134 million in 2008.
Other Real Estate Owned Expense
Other real estate owned (“OREO”) expenses include the cost of adjusting foreclosed properties to fair value
after these assets have been classified as OREO and net gains and losses on sales of properties, as well as other
costs to maintain the property such as property taxes, security, grounds maintenance, etc. Despite Regions’
aggressive and successful efforts to sell foreclosed properties, balances increased $364 million to $607 million in
2009 compared to $243 million in 2008 due to increasing numbers of foreclosures. OREO expense increased $72
million to $175 million in 2009 compared to $103 million in 2008, driven by a significant increase in OREO
balances, coupled with property valuation declines resulting from further deterioration of the housing and real
estate markets. See Note 10 “Foreclosed Properties” to the consolidated financial statements.
Marketing
Marketing expense decreased $22 million during 2009 to $75 million compared to $97 million in 2008. The
decrease was driven by $13 million of merger-related charges in 2008.
Goodwill Impairment
Regions incurred a $6.0 billion non-cash goodwill impairment charge as a result of a goodwill evaluation
performed in the fourth quarter of 2008. This evaluation indicated the estimated implied fair value of the General
Banking/Treasury reporting unit’s goodwill was less than its book value, therefore requiring the impairment
charge. Refer to Note 1 “Summary of Significant Accounting Policies” and Note 9 “Intangible Assets” to the
consolidated financial statements for further discussion.
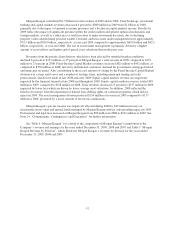
Other-Than-Temporary Impairments (OTTI)
OTTI increased $52 million during 2009 to $75 million compared to $23 million in 2008. Refer to Note 4
“Securities” to the consolidated financial statements for further discussion.
Mortgage Servicing Rights Impairment
Mortgage servicing rights impairment was $85 million in 2008. There was no impairment related to
mortgage servicing rights in 2009 as the Company elected the fair value method as of January 1, 2009. Refer to
Note 1 “Summary of Significant Accounting Policies” to the consolidated financial statements for further details.
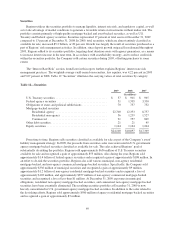
FDIC Premiums and Special Assessment
FDIC premiums increased in 2009 by $212 million to $227 million. The increases resulted from higher
premium rates applied to a higher level of insured deposit balances. On October 7, 2008, the FDIC increased the
rates banks pay for deposit insurance, while at the same time making adjustments to the system that determines
what rate a bank pays the FDIC. Under this and additional proposals, the assessment rate schedule was raised on
January 1, 2009. The bank regulatory agencies’ ratings, comprised of Regions Bank’s capital, asset quality,
management, earnings, liquidity and sensitivity to risk, along with its long-term debt issuer ratings and financial
ratios are the primary factors in determining FDIC insurance premiums.
Additionally, during early 2009 Regions utilized its remaining assessment credits, which had previously
offset a substantial portion of premium cost. Regions qualified for a credit of approximately $110 million, which
was applied toward premiums in 2009, 2008 and 2007, thereby exhausting the credit.
63