Regions Bank 2009 Annual Report Download - page 149
Download and view the complete annual report
Please find page 149 of the 2009 Regions Bank annual report below. You can navigate through the pages in the report by either clicking on the pages listed below, or by using the keyword search tool below to find specific information within the annual report.-
 1
1 -
2
-
3
-
4
-
5
-
6
-
7
-
8
-
9
-
10
-
11
-
12
-
13
-
14
-
15
-
16
-
17
-
18
-
19
-
20
-
21
-
22
-
23
-
24
-
25
-
26
-
27
-
28
-
29
-
30
-
31
-
32
-
33
-
34
-
35
-
36
-
37
-
38
-
39
-
40
-
41
-
42
-
43
-
44
-
45
-
46
-
47
-
48
-
49
-
50
-
51
-
52
-
53
-
54
-
55
-
56
-
57
-
58
-
59
-
60
-
61
-
62
-
63
-
64
-
65
-
66
-
67
-
68
-
69
-
70
-
71
-
72
-
73
-
74
-
75
-
76
-
77
-
78
-
79
-
80
-
81
-
82
-
83
-
84
-
85
-
86
-
87
-
88
-
89
-
90
-
91
-
92
-
93
-
94
-
95
-
96
-
97
-
98
-
99
-
100
-
101
-
102
-
103
-
104
-
105
-
106
-
107
-
108
-
109
-
110
-
111
-
112
-
113
-
114
-
115
-
116
-
117
-
118
-
119
-
120
-
121
-
122
-
123
-
124
-
125
-
126
-
127
-
128
-
129
-
130
-
131
-
132
-
133
-
134
-
135
-
136
-
137
-
138
-
 139
139 -
 140
140 -
 141
141 -
 142
142 -
 143
143 -
 144
144 -
 145
145 -
 146
146 -
 147
147 -
 148
148 -
 149
149 -
 150
150 -
 151
151 -
 152
152 -
 153
153 -
 154
154 -
 155
155 -
 156
156 -
 157
157 -
 158
158 -
 159
159 -
160
-
161
-
162
-
163
-
164
-
165
-
166
-
167
-
168
-
169
-
170
-
171
-
172
-
173
-
174
-
175
-
176
-
177
-
178
-
179
-
180
-
181
-
182
-
183
-
184
-
185
-
186
-
187
-
188
-
189
-
190
-
191
-
192
-
193
-
194
-
195
-
196
-
197
-
198
-
199
-
200
-
201
-
202
-
203
-
204
-
205
-
206
-
207
-
208
-
209
-
210
-
211
-
212
-
213
-
214
-
215
-
216
-
217
-
218
-
219
-
220
 |
 |

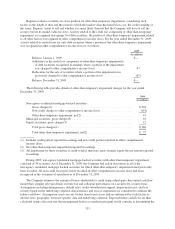
The cost and estimated fair value of securities available for sale and securities held to maturity at
December 31, 2009, by contractual maturity, are shown below. Expected maturities will differ from contractual
maturities because borrowers may have the right to call or prepay obligations with or without call or prepayment
penalties.
Cost
Estimated
Fair Value
(In millions)
Securities available for sale:
Due in one year or less .................................................. $ 37 $ 38
Due after one year through five years ....................................... 68 72
Due after five years through ten years ....................................... 11 11
Due after ten years ...................................................... 66 63
Mortgage-backed securities:
Residential agency .................................................. 22,271 22,684
Residential non-agency .............................................. 33 36
Commercial agency ................................................. 20 21
Equity securities ....................................................... 1,132 1,144
$23,638 $24,069
Securities held to maturity:
Due in one year or less .................................................. $ 4 $ 4
Due after one year through five years ....................................... 8 8
Due after five years through ten years ....................................... 3 3
Due after ten years ...................................................... — —
Mortgage-backed securities:
Residential agency .................................................. 16 16
$31$31
Proceeds from sales of securities available for sale in 2009 were $5.5 billion, with gross realized gains and
losses of $187 million and $118 million, respectively. Proceeds from sales of securities available for sale in 2008
were $2.1 billion, with gross realized gains and losses of $95 million and $3 million, respectively. Proceeds from
sales of securities available for sale in 2007 were $2.0 billion, with gross realized gains and losses of $41 million
and $50 million, respectively. The cost of securities sold is based on the specific identification method.
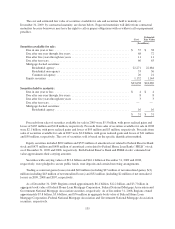
Equity securities included $492 million and $533 million of amortized cost related to Federal Reserve Bank
stock and $473 million and $458 million of amortized cost related to Federal Home Loan Bank (“FHLB”) stock
as of December 31, 2009 and 2008, respectively. Both Federal Reserve Bank and FHLB stocks’ estimated fair
value approximates their carrying amounts.
Securities with carrying values of $12.4 billion and $16.1 billion at December 31, 2009 and 2008,
respectively, were pledged to secure public funds, trust deposits and certain borrowing arrangements.
Trading account net gains (losses) totaled $60 million (including $27 million of net unrealized gains), $(2)
million (including $43 million of net unrealized losses) and $32 million (including $2 million of net unrealized
losses) in 2009, 2008 and 2007, respectively.
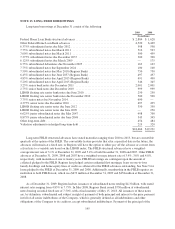
As of December 31, 2009, Regions owned approximately $6.4 billion, $12.2 billion, and $3.7 billion in
aggregate book value of Federal Home Loan Mortgage Corporation, Federal National Mortgage Association and
Government National Mortgage Association securities, respectively. As of December 31, 2008, Regions owned
approximately $7.8 billion, $5.6 billion, and $76 million in aggregate book value of Federal Home Loan
Mortgage Corporation, Federal National Mortgage Association and Government National Mortgage Association
securities, respectively.
135