Regions Bank 2009 Annual Report Download - page 78
Download and view the complete annual report
Please find page 78 of the 2009 Regions Bank annual report below. You can navigate through the pages in the report by either clicking on the pages listed below, or by using the keyword search tool below to find specific information within the annual report.-
 1
1 -
2
-
3
-
4
-
5
-
6
-
7
-
8
-
9
-
10
-
11
-
12
-
13
-
14
-
15
-
16
-
17
-
18
-
19
-
20
-
21
-
22
-
23
-
24
-
25
-
26
-
27
-
28
-
29
-
30
-
31
-
32
-
33
-
34
-
35
-
36
-
37
-
38
-
39
-
40
-
41
-
42
-
43
-
44
-
45
-
46
-
47
-
48
-
49
-
50
-
51
-
52
-
53
-
54
-
55
-
56
-
57
-
58
-
59
-
60
-
61
-
62
-
63
-
64
-
65
-
66
-
67
-
 68
68 -
 69
69 -
 70
70 -
 71
71 -
 72
72 -
 73
73 -
 74
74 -
 75
75 -
 76
76 -
 77
77 -
 78
78 -
 79
79 -
 80
80 -
 81
81 -
 82
82 -
 83
83 -
 84
84 -
 85
85 -
 86
86 -
 87
87 -
 88
88 -
89
-
90
-
91
-
92
-
93
-
94
-
95
-
96
-
97
-
98
-
99
-
100
-
101
-
102
-
103
-
104
-
105
-
106
-
107
-
108
-
109
-
110
-
111
-
112
-
113
-
114
-
115
-
116
-
117
-
118
-
119
-
120
-
121
-
122
-
123
-
124
-
125
-
126
-
127
-
128
-
129
-
130
-
131
-
132
-
133
-
134
-
135
-
136
-
137
-
138
-
139
-
140
-
141
-
142
-
143
-
144
-
145
-
146
-
147
-
148
-
149
-
150
-
151
-
152
-
153
-
154
-
155
-
156
-
157
-
158
-
159
-
160
-
161
-
162
-
163
-
164
-
165
-
166
-
167
-
168
-
169
-
170
-
171
-
172
-
173
-
174
-
175
-
176
-
177
-
178
-
179
-
180
-
181
-
182
-
183
-
184
-
185
-
186
-
187
-
188
-
189
-
190
-
191
-
192
-
193
-
194
-
195
-
196
-
197
-
198
-
199
-
200
-
201
-
202
-
203
-
204
-
205
-
206
-
207
-
208
-
209
-
210
-
211
-
212
-
213
-
214
-
215
-
216
-
217
-
218
-
219
-
220
 |
 |
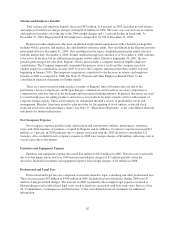
Under existing federal regulations, every FDIC-insured institution will pay some level of deposit insurance
assessments regardless of the level of designated reserve ratio. Regions incurred a $64 million special assessment
in 2009 to help replenish the Deposit Insurance Fund. Additionally, the FDIC required all institutions to prepay,
by December 31, 2009, estimated assessments for the fourth quarter of 2009 (typically paid one quarter in
arrears), and for all of 2010, 2011, and 2012, with a 3 basis point increase beginning in 2011. Regions expects the
FDIC premium expense to remain elevated in future years.
Other Miscellaneous Expenses
Other miscellaneous expenses include communications, valuation impairment charges and business
development services. Other miscellaneous expenses decreased $252 million to $736 million in 2009. Included in
other miscellaneous expenses are merger charges totaling $38 million in 2008. The decline in 2009 was
attributable to several factors. As discussed above, in January 2009, Regions began accounting for mortgage
servicing rights at fair market value with any changes to fair value being recorded in mortgage income. At that
time, Regions was no longer required to adjust non-interest expense for amortization of mortgage servicing
rights. The impact of the amortization expense for 2008 was $75 million and there was no corresponding impact
in 2009. Also, included in other non-interest expense in 2008 was $49 million of write-downs on investments in
two Morgan Keegan mutual funds with no similar expense during 2009. In addition, non-interest expense was
negatively impacted in 2008 by a $65 million loss on the early extinguishment of debt.
INCOME TAXES
Regions’ 2009 benefit for income taxes from continuing operations decreased $177 million to a tax benefit
of $171 million compared to a tax benefit of $348 million in 2008. The decrease in the benefit is primarily
related to the tax expenses on leveraged lease terminations in 2009 and the release of uncertain tax position
reserves that occurred in 2008.
Periodically, Regions invests in pass-through investment vehicles that generate tax credits, principally
low-income housing credits, which directly reduce Regions’ federal income tax liability. Congress has enacted
these tax credit programs to encourage capital inflows to these investment vehicles. The amount of tax benefit
recognized from these tax credits was $80 million in 2009 compared to $56 million in 2008.
Regions has segregated a portion of its investment securities and intellectual property into separate legal
entities in order to, among other business purposes, maximize the return on such assets by the professional and
focused management thereof. Regions recognized state tax benefits related to these legal entities of $24 million
in 2009 compared to $38 million in 2008.
Management’s determination of the realization of deferred tax assets ($950 million on a net basis) is based
upon management’s judgment of various future events and uncertainties, including the timing, nature and amount
of future taxable income earned by certain subsidiaries and the implementation of various plans to maximize
realization of deferred tax assets in addition to taxable income within the carryback period and reversal of taxable
temporary differences. In making its determination of the realization of the net deferred tax asset, management
has considered all positive and negative evidence available as of December 31, 2009. Excluding the impact of the
$6.0 billion goodwill impairment during 2008, Regions would have had a cumulative three-year pretax income of
approximately $669 million for 2007 through 2009. Regions concluded that it is appropriate to consider the
three-year cumulative position excluding goodwill, given that the goodwill impairment charge is not treated as
tax deductible. Management believes Regions will generate sufficient operating earnings to realize the deferred
tax benefits.
Regions also has carryback potential to taxable income in prior years allowed by the tax law and future
reversal of taxable temporary differences. In addition to tax planning strategies, management has given
consideration to projected earnings in future years within the statutory tax loss carryforward periods that
significantly exceed total deferred tax assets due to Regions’ strong capital position and history of strong and
significant pre-tax earnings.
64