Regions Bank 2009 Annual Report Download - page 187
Download and view the complete annual report
Please find page 187 of the 2009 Regions Bank annual report below. You can navigate through the pages in the report by either clicking on the pages listed below, or by using the keyword search tool below to find specific information within the annual report.-
 1
1 -
2
-
3
-
4
-
5
-
6
-
7
-
8
-
9
-
10
-
11
-
12
-
13
-
14
-
15
-
16
-
17
-
18
-
19
-
20
-
21
-
22
-
23
-
24
-
25
-
26
-
27
-
28
-
29
-
30
-
31
-
32
-
33
-
34
-
35
-
36
-
37
-
38
-
39
-
40
-
41
-
42
-
43
-
44
-
45
-
46
-
47
-
48
-
49
-
50
-
51
-
52
-
53
-
54
-
55
-
56
-
57
-
58
-
59
-
60
-
61
-
62
-
63
-
64
-
65
-
66
-
67
-
68
-
69
-
70
-
71
-
72
-
73
-
74
-
75
-
76
-
77
-
78
-
79
-
80
-
81
-
82
-
83
-
84
-
85
-
86
-
87
-
88
-
89
-
90
-
91
-
92
-
93
-
94
-
95
-
96
-
97
-
98
-
99
-
100
-
101
-
102
-
103
-
104
-
105
-
106
-
107
-
108
-
109
-
110
-
111
-
112
-
113
-
114
-
115
-
116
-
117
-
118
-
119
-
120
-
121
-
122
-
123
-
124
-
125
-
126
-
127
-
128
-
129
-
130
-
131
-
132
-
133
-
134
-
135
-
136
-
137
-
138
-
139
-
140
-
141
-
142
-
143
-
144
-
145
-
146
-
147
-
148
-
149
-
150
-
151
-
152
-
153
-
154
-
155
-
156
-
157
-
158
-
159
-
160
-
161
-
162
-
163
-
164
-
165
-
166
-
167
-
168
-
169
-
170
-
171
-
172
-
173
-
174
-
175
-
176
-
 177
177 -
 178
178 -
 179
179 -
 180
180 -
 181
181 -
 182
182 -
 183
183 -
 184
184 -
 185
185 -
 186
186 -
 187
187 -
 188
188 -
 189
189 -
 190
190 -
 191
191 -
 192
192 -
 193
193 -
 194
194 -
 195
195 -
 196
196 -
 197
197 -
198
-
199
-
200
-
201
-
202
-
203
-
204
-
205
-
206
-
207
-
208
-
209
-
210
-
211
-
212
-
213
-
214
-
215
-
216
-
217
-
218
-
219
-
220
 |
 |

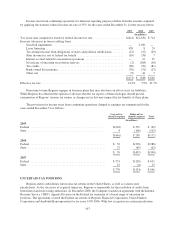
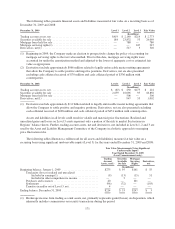
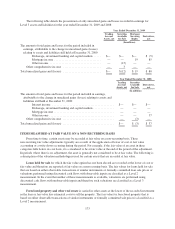
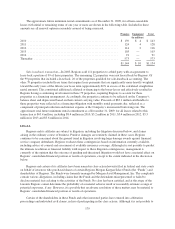
The following table details the presentation of only unrealized gains and losses recorded in earnings for
Level 3 assets and liabilities for the year ended December 31, 2009 and 2008:
Year Ended December 31, 2009
Trading
Account
Assets, net
Securities
Available
for Sale
Mortgage
Servicing
Rights
Derivatives,
net
(In millions)
The amount of total gains and losses for the period included in
earnings, attributable to the change in unrealized gains (losses)
relating to assets and liabilities still held at December 31, 2009:
Brokerage, investment banking and capital markets ..... $— $— $— $ (5)
Mortgage income ................................ — — 19 85
Other income ................................... — (15) — —
Other comprehensive income .......................... — 3 — —
Total unrealized gains and (losses) .......................... $— $(12) $ 19 $ 80
Year Ended December 31, 2008
Trading
Account
Assets, net
Securities
Available
for Sale
Derivatives,
net
(In millions)
The amount of total gains and losses for the period included in earnings,
attributable to the change in unrealized gains (losses) relating to assets and
liabilities still held at December 31, 2008:
Interest income .......................................... $— $— $—
Brokerage, investment banking and capital markets .............. — — —
Mortgage income ......................................... — — —
Other income ............................................ — — 37
Other comprehensive income ................................... — (3) —
Total unrealized gains and (losses) ................................... $— $ (3) $ 37
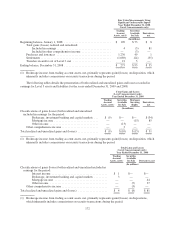
ITEMS MEASURED AT FAIR VALUE ON A NON-RECURRING BASIS
From time to time, certain assets may be recorded at fair value on a non-recurring basis. These
non-recurring fair value adjustments typically are a result of the application of lower of cost or fair value
accounting or a write-down occurring during the period. For example, if the fair value of an asset in these
categories falls below its cost basis, it is considered to be at fair value at the end of the period of the adjustment.
In periods where there is no adjustment, the asset is generally not considered to be at fair value. The following is
a description of the valuation methodologies used for certain assets that are recorded at fair value.
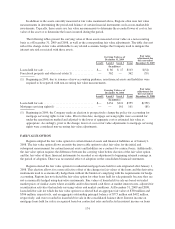
Loans held for sale for which the fair value option has not been elected are recorded at the lower of cost or
fair value and therefore are reported at fair value on a non-recurring basis. The fair values for loans held for sale
that are based on either observable transactions of similar instruments or formally committed loan sale prices or
valuations performed using discounted cash flows with observable inputs are classified as a Level 2
measurement. In the event that neither of these measurements is available, valuations are performed using
discounted cash flows with unobservable inputs and therefore such valuations are classified as a Level 3
measurement.
Foreclosed property and other real estate is carried in other assets at the lower of the recorded investment
in the loan or fair value less estimated costs to sell the property. The fair value for foreclosed property that is
based on either observable transactions of similar instruments or formally committed sale prices is classified as a
Level 2 measurement.
173