Regions Bank 2009 Annual Report Download - page 68
Download and view the complete annual report
Please find page 68 of the 2009 Regions Bank annual report below. You can navigate through the pages in the report by either clicking on the pages listed below, or by using the keyword search tool below to find specific information within the annual report.-
 1
1 -
2
-
3
-
4
-
5
-
6
-
7
-
8
-
9
-
10
-
11
-
12
-
13
-
14
-
15
-
16
-
17
-
18
-
19
-
20
-
21
-
22
-
23
-
24
-
25
-
26
-
27
-
28
-
29
-
30
-
31
-
32
-
33
-
34
-
35
-
36
-
37
-
38
-
39
-
40
-
41
-
42
-
43
-
44
-
45
-
46
-
47
-
48
-
49
-
50
-
51
-
52
-
53
-
54
-
55
-
56
-
57
-
 58
58 -
 59
59 -
 60
60 -
 61
61 -
 62
62 -
 63
63 -
 64
64 -
 65
65 -
 66
66 -
 67
67 -
 68
68 -
 69
69 -
 70
70 -
 71
71 -
 72
72 -
 73
73 -
 74
74 -
 75
75 -
 76
76 -
 77
77 -
 78
78 -
79
-
80
-
81
-
82
-
83
-
84
-
85
-
86
-
87
-
88
-
89
-
90
-
91
-
92
-
93
-
94
-
95
-
96
-
97
-
98
-
99
-
100
-
101
-
102
-
103
-
104
-
105
-
106
-
107
-
108
-
109
-
110
-
111
-
112
-
113
-
114
-
115
-
116
-
117
-
118
-
119
-
120
-
121
-
122
-
123
-
124
-
125
-
126
-
127
-
128
-
129
-
130
-
131
-
132
-
133
-
134
-
135
-
136
-
137
-
138
-
139
-
140
-
141
-
142
-
143
-
144
-
145
-
146
-
147
-
148
-
149
-
150
-
151
-
152
-
153
-
154
-
155
-
156
-
157
-
158
-
159
-
160
-
161
-
162
-
163
-
164
-
165
-
166
-
167
-
168
-
169
-
170
-
171
-
172
-
173
-
174
-
175
-
176
-
177
-
178
-
179
-
180
-
181
-
182
-
183
-
184
-
185
-
186
-
187
-
188
-
189
-
190
-
191
-
192
-
193
-
194
-
195
-
196
-
197
-
198
-
199
-
200
-
201
-
202
-
203
-
204
-
205
-
206
-
207
-
208
-
209
-
210
-
211
-
212
-
213
-
214
-
215
-
216
-
217
-
218
-
219
-
220
 |
 |

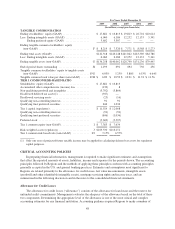
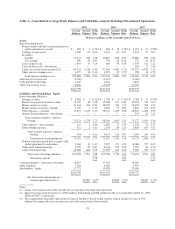
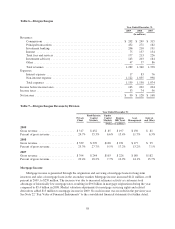
Table 4—Volume and Yield/Rate Variances
2009 Compared to 2008
Change Due to
2008 Compared to 2007
Change Due to
Volume
Yield/
Rate Net Volume
Yield/
Rate Net
(Taxable equivalent basis—in millions)
Interest income on:
Federal funds sold and securities purchased under
agreements to resell ......................... $ (6) $ (9) $ (15) $ (7) $ (26) $ (33)
Trading account assets ......................... 5 (6) (1) 2 (8) (6)
Securities:
Taxable ................................. 159 (21) 138 (4) (24) (28)
Tax-exempt .............................. (20) (12) (32) 1 (3) (2)
Loans held for sale ............................ 37 (18) 19 (52) (23) (75)
Loans held for sale—divestitures ................. — — — (22) — (22)
Loans, net of unearned income ................... (171) (1,173) (1,344) 229 (1,567) (1,338)
Other interest-earning assets ..................... 33 (34) (1) 37 (46) (9)
Total interest-earning assets ..................... 37 (1,273) (1,236) 184 (1,697) (1,513)
Interest expense on:
Savings accounts .............................. — 1 1 — (7) (7)
Interest-bearing transaction accounts .............. (6) (81) (87) (10) (175) (185)
Money market accounts ........................ 49 (194) (145) (36) (267) (303)
Money market accounts—foreign ................ (18) (26) (44) (33) (75) (108)
Time deposits—customer ....................... 154 (208) (54) (10) (173) (183)
Interest-bearing deposits—divestitures ............ — — — (12) — (12)
Total customer deposits—interest-bearing ...... 179 (508) (329) (101) (697) (798)
Time deposits—non customer ................... (46) (27) (73) 31 (26) 5
Other foreign deposits ......................... (22) (23) (45) (67) (80) (147)
Total treasury deposits—interest-bearing ....... (68) (50) (118) (36) (106) (142)
Total interest-bearing deposits ........... 111 (558) (447) (137) (803) (940)
Federal funds purchased and securities sold under
agreements to repurchase ..................... (66) (93) (159) (17) (189) (206)
Other short-term borrowings .................... (60) (96) (156) 171 (55) 116
Long-term borrowings ......................... 202 (163) 39 190 (116) 74
Total interest-bearing liabilities .................. 187 (910) (723) 207 (1,163) (956)
Decrease in net interest income .................. $(150) $ (363) $ (513) $ (23) $ (534) $ (557)
Notes:
1. The change in interest not due solely to volume or yield/rate has been allocated to the volume column and
yield/rate column in proportion to the relationship of the absolute dollar amounts of the change in each.
2. The computation of taxable net interest income is based on the statutory federal income tax rate of 35%,
adjusted for applicable state income taxes net of the related federal tax benefit.
Comparing 2009 to 2008, interest-earning asset yields were lower, decreasing 123 basis points on average.
While interest-bearing liability rates were also lower, declining by 68 basis points, this improvement in funding cost
was not enough to offset the drop in interest-earning asset yields. As a result, the net interest rate spread declined 55
basis points to 2.28 percent in 2009 as compared to 2.83 percent in 2008. Changes in market interest rates and
Regions’ asset sensitive position were the most significant drivers of changes in Regions’ rates and yields.
54