Regions Bank 2009 Annual Report Download - page 108
Download and view the complete annual report
Please find page 108 of the 2009 Regions Bank annual report below. You can navigate through the pages in the report by either clicking on the pages listed below, or by using the keyword search tool below to find specific information within the annual report.-
 1
1 -
2
-
3
-
4
-
5
-
6
-
7
-
8
-
9
-
10
-
11
-
12
-
13
-
14
-
15
-
16
-
17
-
18
-
19
-
20
-
21
-
22
-
23
-
24
-
25
-
26
-
27
-
28
-
29
-
30
-
31
-
32
-
33
-
34
-
35
-
36
-
37
-
38
-
39
-
40
-
41
-
42
-
43
-
44
-
45
-
46
-
47
-
48
-
49
-
50
-
51
-
52
-
53
-
54
-
55
-
56
-
57
-
58
-
59
-
60
-
61
-
62
-
63
-
64
-
65
-
66
-
67
-
68
-
69
-
70
-
71
-
72
-
73
-
74
-
75
-
76
-
77
-
78
-
79
-
80
-
81
-
82
-
83
-
84
-
85
-
86
-
87
-
88
-
89
-
90
-
91
-
92
-
93
-
94
-
95
-
96
-
97
-
 98
98 -
 99
99 -
 100
100 -
 101
101 -
 102
102 -
 103
103 -
 104
104 -
 105
105 -
 106
106 -
 107
107 -
 108
108 -
 109
109 -
 110
110 -
 111
111 -
 112
112 -
 113
113 -
 114
114 -
 115
115 -
 116
116 -
 117
117 -
 118
118 -
119
-
120
-
121
-
122
-
123
-
124
-
125
-
126
-
127
-
128
-
129
-
130
-
131
-
132
-
133
-
134
-
135
-
136
-
137
-
138
-
139
-
140
-
141
-
142
-
143
-
144
-
145
-
146
-
147
-
148
-
149
-
150
-
151
-
152
-
153
-
154
-
155
-
156
-
157
-
158
-
159
-
160
-
161
-
162
-
163
-
164
-
165
-
166
-
167
-
168
-
169
-
170
-
171
-
172
-
173
-
174
-
175
-
176
-
177
-
178
-
179
-
180
-
181
-
182
-
183
-
184
-
185
-
186
-
187
-
188
-
189
-
190
-
191
-
192
-
193
-
194
-
195
-
196
-
197
-
198
-
199
-
200
-
201
-
202
-
203
-
204
-
205
-
206
-
207
-
208
-
209
-
210
-
211
-
212
-
213
-
214
-
215
-
216
-
217
-
218
-
219
-
220
 |
 |

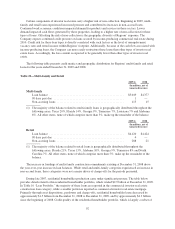
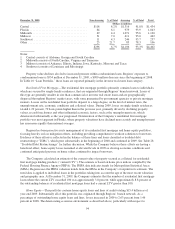
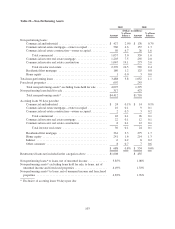
December 31, 2008 Non-Accruing % of Total Accruing % of Total Total
(Dollars in millions)
Central ....................................... $118 8.2% $1,316 91.8% $1,434
Florida ....................................... 64 6.1 979 93.9 1,043
Midsouth ..................................... 49 4.4 1,071 95.6 1,120
Midwest ..................................... 31 7.0 411 93.0 442
Southwest .................................... 11 4.3 246 95.7 257
Other ........................................ 23 21.7 83 78.3 106
$296 6.7% $4,106 93.3% $4,402
Notes:
1 Central consists of Alabama, Georgia and South Carolina
2 Midsouth consists of North Carolina, Virginia and Tennessee
3 Midwest consists of Arkansas, Illinois, Indiana, Iowa, Kentucky, Missouri and Texas
4 Southwest consists of Louisiana and Mississippi
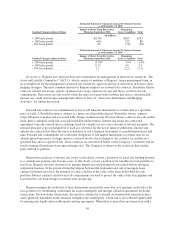
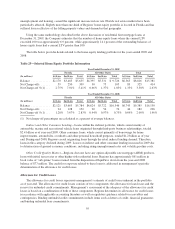
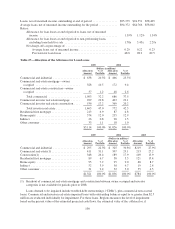
Property value declines also led to increased pressure within condominium loans. Regions’ exposure to
condominium loans is $554 million at December 31, 2009, a $900 million decrease since the beginning of 2008.
In Table 10 “Loan Portfolio,” these loans are reported primarily in the investor real estate loan category.
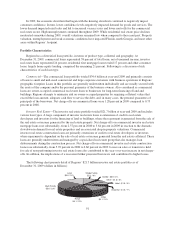
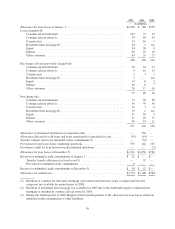
Residential First Mortgage—The residential first mortgage portfolio primarily contains loans to individuals,
which are secured by single-family residences, that are originated through Regions’ branch network. Loans of
this type are generally smaller in size than commercial or investor real estate loans and are geographically
dispersed throughout Regions’ market areas, with some guaranteed by government agencies or private mortgage
insurers. Losses on the residential loan portfolio depend, to a large degree, on the level of interest rates, the
unemployment rate, economic conditions and collateral values. During 2009, losses on single-family residences
totaled 1.29 percent, 79 basis points higher than in the previous year, primarily driven by declining property
values, record foreclosures and other influential economic factors, such as the unemployment rate, which
deteriorated substantially as the year progressed. Deterioration of the Company’s residential first mortgage
portfolio was most apparent in Florida, where property valuations have declined more acutely and unemployment
has risen more rapidly than national averages.
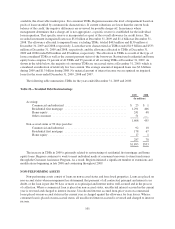
Regions has been proactive in its management of its residential first mortgage and home equity portfolios,
focusing heavily on loss mitigation efforts, including providing comprehensive workout solutions to borrowers.
Evidence of these efforts is reflected in the balance of these lines and loans classified as troubled debt
restructurings (“TDRs”), which grew substantially in the beginning of 2008 and continued in 2009. See Table 28
“Troubled Debt Restructurings” for further discussion. While the Company believes these efforts are having a
beneficial effect, home equity losses remained at elevated levels in 2009 as slowing economic conditions and
continued anticipated pressure on home values continued to impact borrowers.
The Company calculated an estimate of the current value of property secured as collateral for residential
first mortgage lending products (“current LTV”). The estimate is based on home price indices compiled by the
Federal Housing Finance Agency (FHFA). The FHFA data indicates trends for Metropolitan Statistical Areas
(MSA). Regions uses the FHFA valuation trends from the MSAs in the Company’s footprint in its estimate. The
trend data is applied to individual loans in the portfolios taking into account the age of the most recent valuation
and geographic area. At December 31, 2009, the Company estimates that the number of residential first mortgage
loans where the current LTV exceeded 100 was approximately 3.8 percent, while approximately 8.8 percent of
the outstanding balances of residential first mortgage loans had a current LTV greater than 100.
Home Equity—This portfolio contains home equity loans and lines of credit totaling $15.4 billion as of
year-end 2009. Substantially all of this portfolio was originated through Regions’ branch network. As a
percentage of outstanding home equity loans and lines, losses increased in 2009 to 2.63 percent from 1.46
percent in 2008. The deteriorating economic environment as described above, particularly with respect to
94