Regions Bank 2009 Annual Report Download - page 190
Download and view the complete annual report
Please find page 190 of the 2009 Regions Bank annual report below. You can navigate through the pages in the report by either clicking on the pages listed below, or by using the keyword search tool below to find specific information within the annual report.-
 1
1 -
2
-
3
-
4
-
5
-
6
-
7
-
8
-
9
-
10
-
11
-
12
-
13
-
14
-
15
-
16
-
17
-
18
-
19
-
20
-
21
-
22
-
23
-
24
-
25
-
26
-
27
-
28
-
29
-
30
-
31
-
32
-
33
-
34
-
35
-
36
-
37
-
38
-
39
-
40
-
41
-
42
-
43
-
44
-
45
-
46
-
47
-
48
-
49
-
50
-
51
-
52
-
53
-
54
-
55
-
56
-
57
-
58
-
59
-
60
-
61
-
62
-
63
-
64
-
65
-
66
-
67
-
68
-
69
-
70
-
71
-
72
-
73
-
74
-
75
-
76
-
77
-
78
-
79
-
80
-
81
-
82
-
83
-
84
-
85
-
86
-
87
-
88
-
89
-
90
-
91
-
92
-
93
-
94
-
95
-
96
-
97
-
98
-
99
-
100
-
101
-
102
-
103
-
104
-
105
-
106
-
107
-
108
-
109
-
110
-
111
-
112
-
113
-
114
-
115
-
116
-
117
-
118
-
119
-
120
-
121
-
122
-
123
-
124
-
125
-
126
-
127
-
128
-
129
-
130
-
131
-
132
-
133
-
134
-
135
-
136
-
137
-
138
-
139
-
140
-
141
-
142
-
143
-
144
-
145
-
146
-
147
-
148
-
149
-
150
-
151
-
152
-
153
-
154
-
155
-
156
-
157
-
158
-
159
-
160
-
161
-
162
-
163
-
164
-
165
-
166
-
167
-
168
-
169
-
170
-
171
-
172
-
173
-
174
-
175
-
176
-
177
-
178
-
179
-
 180
180 -
 181
181 -
 182
182 -
 183
183 -
 184
184 -
 185
185 -
 186
186 -
 187
187 -
 188
188 -
 189
189 -
 190
190 -
 191
191 -
 192
192 -
 193
193 -
 194
194 -
 195
195 -
 196
196 -
 197
197 -
 198
198 -
 199
199 -
 200
200 -
201
-
202
-
203
-
204
-
205
-
206
-
207
-
208
-
209
-
210
-
211
-
212
-
213
-
214
-
215
-
216
-
217
-
218
-
219
-
220
 |
 |

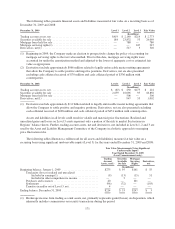
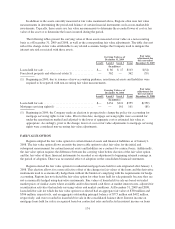
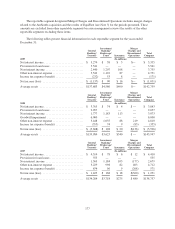
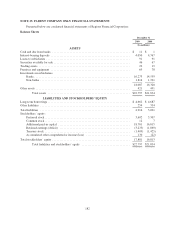
The carrying amounts and estimated fair values of the Company’s financial instruments as of December 31
are as follows:
2009 2008
Carrying
Amount
Estimated
Fair
Value(1)
Carrying
Amount
Estimated
Fair
Value(1)
(In millions)
Financial assets:
Cash and cash equivalents .................................. $ 8,011 $ 8,011 $10,973 $10,973
Trading account assets ..................................... 3,039 3,039 1,050 1,050
Securities available for sale ................................. 24,069 24,069 18,850 18,850
Securities held to maturity .................................. 31 31 47 47
Loans held for sale ........................................ 1,511 1,511 1,282 1,282
Loans (excluding leases), net of unearned income and allowance for
loan losses(2),(3) ....................................... 85,452 72,119 93,062 79,882
Other interest-earning assets ................................ 734 734 897 897
Derivatives, net ........................................... 520 520 1,002 1,002
Financial liabilities:
Deposits ................................................ 98,680 99,168 90,904 91,199
Short-term borrowings ..................................... 3,668 3,668 15,822 15,822
Long-term borrowings ..................................... 18,464 17,710 19,231 18,191
Loan commitments and letters of credit ........................ 194 1,014 109 732
(1) Estimated fair values are consistent with an exit price concept. The assumptions used to estimate the fair
values are intended to approximate those that a market participant would use in a hypothetical orderly
transaction. In estimating fair value, the Company makes adjustments for interest rates, market liquidity and
credit spreads as appropriate.
(2) The estimated fair value of portfolio loans assumes sale of the notes to a third-party financial investor.
Accordingly, the value to the Company if the notes were held to maturity is not reflected in the fair value
estimate. In the current whole loan market, given the lack of market liquidity, financial investors are
generally requiring a much higher rate of return than the return inherent in loans if held to maturity. The fair
value discount at December 31, 2009 of $13.3 billion or 15.6% includes an estimated $9.6 billion or
approximately 72% of the fair value discount, which represents the higher rate of return required by
financial investors.
(3) Excluded from this table is the lease carrying amount of $2.1 billion at December 31, 2009 and $3.0 billion
at December 31, 2008, which approximates fair value.
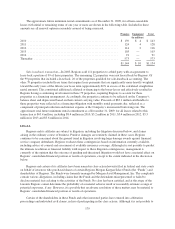
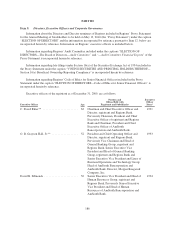
NOTE 23. BUSINESS SEGMENT INFORMATION
Regions’ segment information is presented based on Regions’ key segments of business. Each segment is a
strategic business unit that serves specific needs of Regions’ customers. The Company’s primary segment is
General Banking/Treasury, which represents the Company’s branch network, including consumer and
commercial banking functions, and has separate management that is responsible for the operation of that business
unit. This segment also includes the Company’s Treasury function, including the Company’s securities portfolio
and other wholesale funding activities. Prior to year-end 2008, Regions had reported an Other segment that
included merger charges and the parent company. Regions realigned to include the parent company with General
Banking/Treasury as parent company transactions essentially support the Treasury function. The 2008 and 2007
amounts presented below have been adjusted to conform to the 2009 presentation.
In addition to General Banking/Treasury, Regions has designated as distinct reportable segments the activity
of its Investment Banking/Brokerage/Trust and Insurance divisions. Investment Banking/Brokerage/Trust
includes trust activities and all brokerage and investment activities associated with Morgan Keegan. Insurance
includes all business associated with commercial insurance and credit life products sold to consumer customers.
176