Regions Bank 2009 Annual Report Download - page 98
Download and view the complete annual report
Please find page 98 of the 2009 Regions Bank annual report below. You can navigate through the pages in the report by either clicking on the pages listed below, or by using the keyword search tool below to find specific information within the annual report.-
 1
1 -
2
-
3
-
4
-
5
-
6
-
7
-
8
-
9
-
10
-
11
-
12
-
13
-
14
-
15
-
16
-
17
-
18
-
19
-
20
-
21
-
22
-
23
-
24
-
25
-
26
-
27
-
28
-
29
-
30
-
31
-
32
-
33
-
34
-
35
-
36
-
37
-
38
-
39
-
40
-
41
-
42
-
43
-
44
-
45
-
46
-
47
-
48
-
49
-
50
-
51
-
52
-
53
-
54
-
55
-
56
-
57
-
58
-
59
-
60
-
61
-
62
-
63
-
64
-
65
-
66
-
67
-
68
-
69
-
70
-
71
-
72
-
73
-
74
-
75
-
76
-
77
-
78
-
79
-
80
-
81
-
82
-
83
-
84
-
85
-
86
-
87
-
 88
88 -
 89
89 -
 90
90 -
 91
91 -
 92
92 -
 93
93 -
 94
94 -
 95
95 -
 96
96 -
 97
97 -
 98
98 -
 99
99 -
 100
100 -
 101
101 -
 102
102 -
 103
103 -
 104
104 -
 105
105 -
 106
106 -
 107
107 -
 108
108 -
109
-
110
-
111
-
112
-
113
-
114
-
115
-
116
-
117
-
118
-
119
-
120
-
121
-
122
-
123
-
124
-
125
-
126
-
127
-
128
-
129
-
130
-
131
-
132
-
133
-
134
-
135
-
136
-
137
-
138
-
139
-
140
-
141
-
142
-
143
-
144
-
145
-
146
-
147
-
148
-
149
-
150
-
151
-
152
-
153
-
154
-
155
-
156
-
157
-
158
-
159
-
160
-
161
-
162
-
163
-
164
-
165
-
166
-
167
-
168
-
169
-
170
-
171
-
172
-
173
-
174
-
175
-
176
-
177
-
178
-
179
-
180
-
181
-
182
-
183
-
184
-
185
-
186
-
187
-
188
-
189
-
190
-
191
-
192
-
193
-
194
-
195
-
196
-
197
-
198
-
199
-
200
-
201
-
202
-
203
-
204
-
205
-
206
-
207
-
208
-
209
-
210
-
211
-
212
-
213
-
214
-
215
-
216
-
217
-
218
-
219
-
220
 |
 |

and are of increased importance provided that current and historic low levels of interest rates increase the relative
likelihood of a rapid and substantial increase in interest rates. Regions also includes simulations of gradual
interest rate movements that may more realistically mimic potential interest rate movements. These gradual
scenarios include curve steepening, flattening, and parallel movements of various magnitudes phased in over a
six-month period, and include rate shifts of plus and minus 100 basis points and plus 200 basis points. A 300
basis point shift for the gradual scenarios would produce a resulting relationship similar to the instantaneous 300
basis point scenario.
Exposure to Interest Rate Movements—In September 2009, Regions’ management projected that, although
macro-economic conditions were expected to improve in 2010, the pace of recovery was at risk to underperform
the broader markets’ view. Consequently, Regions anticipated the likelihood that key interest rates would remain
at or near historic lows through most of 2010. Accordingly, with the balance sheet in an asset sensitive position,
net interest income was at risk to underperform. To offset this risk, Regions entered into a series of short-term,
receive-fixed derivative instruments with final maturity in September 2010. These derivative instruments will
offset the negative impact to net interest income from the expected low-rate environment during their term;
however, should rates unexpectedly rise during their term, these derivatives could serve to partially offset the
benefits that would have otherwise been realized from a rising rate environment.
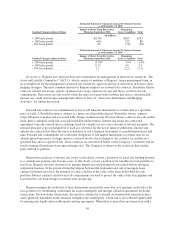
Inclusive of all interest-rate risk hedging activities, as of December 31, 2009, Regions was moderately asset
sensitive to both gradual and instantaneous rate shifts as compared to the base case for the measurement horizon
ending in December 2010. Upon final maturity of the short-term derivatives in September 2010, Regions will be
more asset sensitive. To illustrate the impact to sensitivity attributable to maturity of the short-term derivatives in
September 2010, the net interest income sensitivity specifically attributable to these derivatives and the
sensitivity excluding these derivatives (“remaining assets / liabilities”) are both provided in the table below.
Table 20—Interest Rate Sensitivity
Estimated Amount of Change in Annual Net Interest Income
as of December 31, 2009
Instantaneous Change in Interest Rates
Impact of Short-Term
Derivatives Maturing September 2010
Remaining
Assets / Liabilities Total
(in millions)
+ 300 basis points ............... $(233) $ 390 $157
+ 200 basis points ............... (155) 278 123
+ 100 basis points ............... (77) 174 97
- 100 basis points ............... 41 (85) (44)
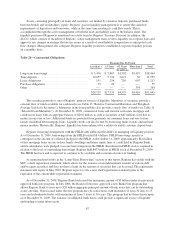
Estimated Percentage Change in Annual Net Interest Income
as of December 31, 2009
Instantaneous Change in Interest Rates
Impact of Short-Term Derivatives
Maturing September 2010
Remaining
Assets / Liabilities Total
+ 300 basis points ............... (7.0)% 11.7% 4.6%
+ 200 basis points ............... (4.6) 8.3 3.6
+ 100 basis points ............... (2.3) 5.2 2.8
- 100 basis points ............... 1.2 (2.5) (1.3)
84