Regions Bank 2009 Annual Report Download - page 64
Download and view the complete annual report
Please find page 64 of the 2009 Regions Bank annual report below. You can navigate through the pages in the report by either clicking on the pages listed below, or by using the keyword search tool below to find specific information within the annual report.-
 1
1 -
2
-
3
-
4
-
5
-
6
-
7
-
8
-
9
-
10
-
11
-
12
-
13
-
14
-
15
-
16
-
17
-
18
-
19
-
20
-
21
-
22
-
23
-
24
-
25
-
26
-
27
-
28
-
29
-
30
-
31
-
32
-
33
-
34
-
35
-
36
-
37
-
38
-
39
-
40
-
41
-
42
-
43
-
44
-
45
-
46
-
47
-
48
-
49
-
50
-
51
-
52
-
53
-
 54
54 -
 55
55 -
 56
56 -
 57
57 -
 58
58 -
 59
59 -
 60
60 -
 61
61 -
 62
62 -
 63
63 -
 64
64 -
 65
65 -
 66
66 -
 67
67 -
 68
68 -
 69
69 -
 70
70 -
 71
71 -
 72
72 -
 73
73 -
 74
74 -
75
-
76
-
77
-
78
-
79
-
80
-
81
-
82
-
83
-
84
-
85
-
86
-
87
-
88
-
89
-
90
-
91
-
92
-
93
-
94
-
95
-
96
-
97
-
98
-
99
-
100
-
101
-
102
-
103
-
104
-
105
-
106
-
107
-
108
-
109
-
110
-
111
-
112
-
113
-
114
-
115
-
116
-
117
-
118
-
119
-
120
-
121
-
122
-
123
-
124
-
125
-
126
-
127
-
128
-
129
-
130
-
131
-
132
-
133
-
134
-
135
-
136
-
137
-
138
-
139
-
140
-
141
-
142
-
143
-
144
-
145
-
146
-
147
-
148
-
149
-
150
-
151
-
152
-
153
-
154
-
155
-
156
-
157
-
158
-
159
-
160
-
161
-
162
-
163
-
164
-
165
-
166
-
167
-
168
-
169
-
170
-
171
-
172
-
173
-
174
-
175
-
176
-
177
-
178
-
179
-
180
-
181
-
182
-
183
-
184
-
185
-
186
-
187
-
188
-
189
-
190
-
191
-
192
-
193
-
194
-
195
-
196
-
197
-
198
-
199
-
200
-
201
-
202
-
203
-
204
-
205
-
206
-
207
-
208
-
209
-
210
-
211
-
212
-
213
-
214
-
215
-
216
-
217
-
218
-
219
-
220
 |
 |
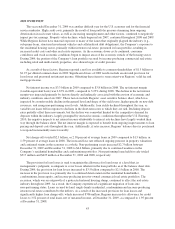
liability (an entry price), in an orderly transaction between market participants at the measurement date under
current market conditions. While management uses judgment when determining the price at which willing
market participants would transact when there has been a significant decrease in the volume or level of activity
for the asset or liability in relation to “normal” market activity, management’s objective is to determine the point
within the range of fair-value estimates that is most representative of a sale to a third-party financial investor
under current market conditions. The value to the Company if the asset or liability were held to maturity is not
included in the fair value estimates.
A fair value measure should reflect the assumptions that market participants would use in pricing the asset
or liability, including the assumptions about the risk inherent in a particular valuation technique, the effect of a
restriction on the sale or use of an asset and the risk of nonperformance. Fair value is measured based on inputs
the Company utilizes. Fair value may be based on quoted market prices for identical assets or liabilities traded in
active markets (Level 1 valuations). If market prices are not available, quoted prices for identical or similar
instruments in markets that are not active and model-based valuation techniques for which all significant
assumptions are observable in the market are used (Level 2 valuations). Where observable market data is not
available, the valuation is generated from model-based techniques that use significant assumptions not
observable in the market, but observable based on Company-specific data (Level 3 valuations). These
unobservable assumptions reflect the Company’s own estimates for assumptions that market participants would
use in pricing the asset or liability. Valuation techniques typically include option pricing models, discounted cash
flow models and similar techniques, but may also include the use of market prices of assets or liabilities that are
not directly comparable to the subject asset or liability.
See Note 22, “Fair Value Measurements” for a detailed discussion of determining fair value.
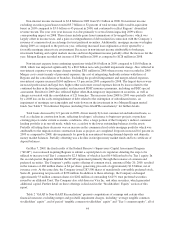
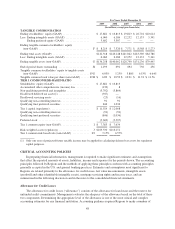
Intangible Assets
Regions’ intangible assets consist primarily of the excess of cost over the fair value of net assets of acquired
businesses (goodwill) and other identifiable intangible assets (primarily core deposit intangibles). Regions’
goodwill is tested for impairment annually or more often if events or circumstances indicate impairment may
exist. Adverse changes in the economic environment, declining operations of the business unit, or other factors
could result in a decline in the estimated implied fair value of goodwill. If the estimated implied fair value is less
than the carrying amount, a loss would be recognized to reduce the carrying amount to the estimated implied fair
value.
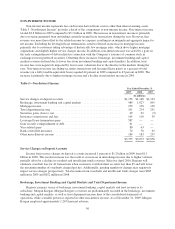
For purposes of testing goodwill for impairment, Regions uses both the income and market approaches to
value its reporting units. The income approach consists of discounting long-term projected future cash flows,
which are derived from internal forecasts and economic expectations for the respective reporting units. The
projected future cash flows are discounted using cost of capital metrics for Regions’ peer group or a build-up
approach (such as the capital asset pricing model). The market approach applies a market multiple, based on
observed purchase transactions and/or price/earnings of Regions’ peer group for each reporting unit, to the last
twelve months of net income or earnings before income taxes, depreciation and amortization or price/tangible
book value. One of the critical assumptions in determining the estimated fair value of a reporting unit is the
discount rate, which can change based on changes in the business climate. A decrease in the discount rate by one
percentage point would result in an increase of approximately $1.0 billion in fair value for all reporting units and
an increase of approximately $806 million in fair value for the General Banking/Treasury reporting unit. An
increase in the discount rate by one percentage point would result in a decline of approximately $929 million in
fair value for all reporting units and a decline of approximately $689 million in fair value for the General
Banking/Treasury reporting unit. A variation in the discount rate may result in or from changes to other
assumptions used in determining the estimated fair value; these changes could materially affect the sensitivities
described above.
If the estimated implied fair value of goodwill is less than the carrying amount, a loss would be recognized
to reduce the carrying amount to the estimated implied fair value. The changes or factors mentioned above, when
50