Regions Bank 2009 Annual Report Download - page 60
Download and view the complete annual report
Please find page 60 of the 2009 Regions Bank annual report below. You can navigate through the pages in the report by either clicking on the pages listed below, or by using the keyword search tool below to find specific information within the annual report.-
 1
1 -
2
-
3
-
4
-
5
-
6
-
7
-
8
-
9
-
10
-
11
-
12
-
13
-
14
-
15
-
16
-
17
-
18
-
19
-
20
-
21
-
22
-
23
-
24
-
25
-
26
-
27
-
28
-
29
-
30
-
31
-
32
-
33
-
34
-
35
-
36
-
37
-
38
-
39
-
40
-
41
-
42
-
43
-
44
-
45
-
46
-
47
-
48
-
49
-
 50
50 -
 51
51 -
 52
52 -
 53
53 -
 54
54 -
 55
55 -
 56
56 -
 57
57 -
 58
58 -
 59
59 -
 60
60 -
 61
61 -
 62
62 -
 63
63 -
 64
64 -
 65
65 -
 66
66 -
 67
67 -
 68
68 -
 69
69 -
 70
70 -
71
-
72
-
73
-
74
-
75
-
76
-
77
-
78
-
79
-
80
-
81
-
82
-
83
-
84
-
85
-
86
-
87
-
88
-
89
-
90
-
91
-
92
-
93
-
94
-
95
-
96
-
97
-
98
-
99
-
100
-
101
-
102
-
103
-
104
-
105
-
106
-
107
-
108
-
109
-
110
-
111
-
112
-
113
-
114
-
115
-
116
-
117
-
118
-
119
-
120
-
121
-
122
-
123
-
124
-
125
-
126
-
127
-
128
-
129
-
130
-
131
-
132
-
133
-
134
-
135
-
136
-
137
-
138
-
139
-
140
-
141
-
142
-
143
-
144
-
145
-
146
-
147
-
148
-
149
-
150
-
151
-
152
-
153
-
154
-
155
-
156
-
157
-
158
-
159
-
160
-
161
-
162
-
163
-
164
-
165
-
166
-
167
-
168
-
169
-
170
-
171
-
172
-
173
-
174
-
175
-
176
-
177
-
178
-
179
-
180
-
181
-
182
-
183
-
184
-
185
-
186
-
187
-
188
-
189
-
190
-
191
-
192
-
193
-
194
-
195
-
196
-
197
-
198
-
199
-
200
-
201
-
202
-
203
-
204
-
205
-
206
-
207
-
208
-
209
-
210
-
211
-
212
-
213
-
214
-
215
-
216
-
217
-
218
-
219
-
220
 |
 |
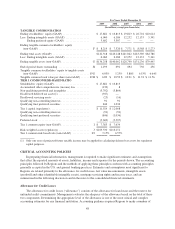
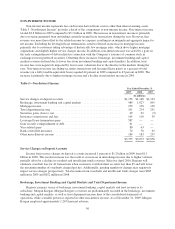
appropriate GAAP or regulatory components to ensure that the Company’s operating results and capital
performance are properly reflected for period-to-period comparisons. Although these non-GAAP financial
measures are frequently used by stakeholders in the evaluation of a company, they have limitations as analytical
tools, and should not be considered in isolation, or as a substitute for analyses of results as reported under GAAP.
In particular, a measure of earnings that excludes merger and goodwill impairment charges does not represent the
amount that effectively accrues directly to stockholders (i.e., merger and goodwill impairment charges are a
reduction to earnings and stockholders’ equity).
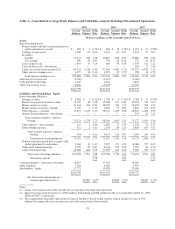
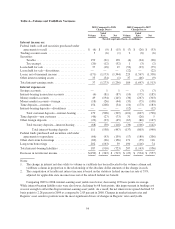
See Table 2 “GAAP to Non-GAAP Reconciliation” below which provides: 1) reconciliations of GAAP net
income (loss) available to common shareholders and earnings per common share to non-GAAP financial
measures, 2) a reconciliation of average and ending stockholders’ equity (GAAP) to average and ending tangible
common stockholders’ equity (non-GAAP), and 3) a reconciliation of stockholders’ equity (GAAP) to Tier 1
capital (regulatory) and to Tier 1 common equity (non-GAAP).
46