Regions Bank 2009 Annual Report Download - page 71
Download and view the complete annual report
Please find page 71 of the 2009 Regions Bank annual report below. You can navigate through the pages in the report by either clicking on the pages listed below, or by using the keyword search tool below to find specific information within the annual report.-
 1
1 -
2
-
3
-
4
-
5
-
6
-
7
-
8
-
9
-
10
-
11
-
12
-
13
-
14
-
15
-
16
-
17
-
18
-
19
-
20
-
21
-
22
-
23
-
24
-
25
-
26
-
27
-
28
-
29
-
30
-
31
-
32
-
33
-
34
-
35
-
36
-
37
-
38
-
39
-
40
-
41
-
42
-
43
-
44
-
45
-
46
-
47
-
48
-
49
-
50
-
51
-
52
-
53
-
54
-
55
-
56
-
57
-
58
-
59
-
60
-
 61
61 -
 62
62 -
 63
63 -
 64
64 -
 65
65 -
 66
66 -
 67
67 -
 68
68 -
 69
69 -
 70
70 -
 71
71 -
 72
72 -
 73
73 -
 74
74 -
 75
75 -
 76
76 -
 77
77 -
 78
78 -
 79
79 -
 80
80 -
 81
81 -
82
-
83
-
84
-
85
-
86
-
87
-
88
-
89
-
90
-
91
-
92
-
93
-
94
-
95
-
96
-
97
-
98
-
99
-
100
-
101
-
102
-
103
-
104
-
105
-
106
-
107
-
108
-
109
-
110
-
111
-
112
-
113
-
114
-
115
-
116
-
117
-
118
-
119
-
120
-
121
-
122
-
123
-
124
-
125
-
126
-
127
-
128
-
129
-
130
-
131
-
132
-
133
-
134
-
135
-
136
-
137
-
138
-
139
-
140
-
141
-
142
-
143
-
144
-
145
-
146
-
147
-
148
-
149
-
150
-
151
-
152
-
153
-
154
-
155
-
156
-
157
-
158
-
159
-
160
-
161
-
162
-
163
-
164
-
165
-
166
-
167
-
168
-
169
-
170
-
171
-
172
-
173
-
174
-
175
-
176
-
177
-
178
-
179
-
180
-
181
-
182
-
183
-
184
-
185
-
186
-
187
-
188
-
189
-
190
-
191
-
192
-
193
-
194
-
195
-
196
-
197
-
198
-
199
-
200
-
201
-
202
-
203
-
204
-
205
-
206
-
207
-
208
-
209
-
210
-
211
-
212
-
213
-
214
-
215
-
216
-
217
-
218
-
219
-
220
 |
 |
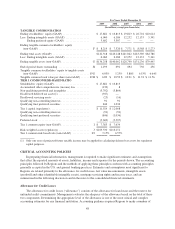
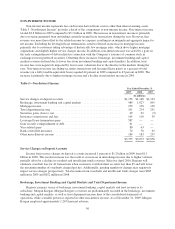
Morgan Keegan contributed $1.3 billion in total revenues in 2009 and in 2008. Total brokerage, investment
banking and capital markets revenues decreased 4 percent to $989 million in 2009 from $1 billion in 2008,
primarily due to the impact of general economic pressures and a decline in capital markets income. Results for
2009 reflect the impact of significant pressure within the credit markets and general upheaval in domestic and
foreign markets, as well as a reluctance of retail investors to make investment decisions, due to declining
property values and declining personal wealth. Customer and trust assets under management were approximately
$75.5 billion and $70.0 billion, respectively, at year-end 2009 compared to approximately $63.0 billion and $62.1
billion, respectively, at year-end 2008. The rise in assets under management is primarily driven by a higher
amount of asset inflows and higher end of period asset valuations than in the prior year.
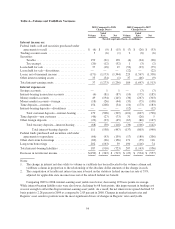
Revenues from the private client division, which have been affected by unsettled market conditions,
declined 6 percent to $317 million, or 25 percent of Morgan Keegan’s total revenue in 2009 compared to $339
million or 25 percent in 2008. Fixed-Income Capital Markets revenues increased $82 million to $452 million, as
compared to $370 million in 2008, driven by institutional customers’ demand for government, mortgage-backed
and municipal securities. Also contributing to the record amount of volume by the Fixed-Income Capital Markets
division was a steep yield curve and a number of strategic hires, including municipal trading and sales
professionals, which were made in late 2008 and early 2009. Equity capital markets revenue was negatively
impacted by the financial turmoil in late 2008 and throughout 2009. Equity capital markets revenues totaled $85
million in 2009, compared to $128 million in 2008. Trust revenues decreased 15 percent to $197 million in 2009,
impacted by lower fees which are driven by lower average asset valuations. In addition, 2008 reflected the
benefit of revenues from the negotiation of natural lease drilling rights on customer properties which did not
repeat in 2009. The asset management division produced $150 million of revenue in 2009 compared to $177
million in 2008, pressured by a lower amount of fees from commissions.
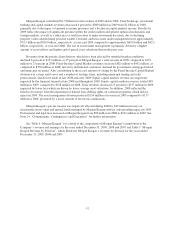
Morgan Keegan’s pre-tax income was negatively affected during 2008 by $49 million in losses on
investments in two open-end mutual funds managed by Morgan Keegan with no corresponding impact in 2009.
Professional and legal fees increased at Morgan Keegan from $90 million in 2008 to $161 million in 2009. See
Note 24, “Commitments, Contingencies and Guarantees” for further information.
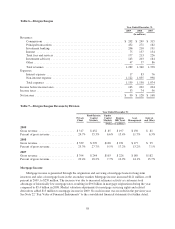
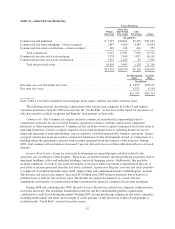
See Table 6 “Morgan Keegan” for a detail of the components of Morgan Keegan’s contribution to the
Company’s revenue and earnings for the years ended December 31, 2009, 2008 and 2007 and Table 7 “Morgan
Keegan Revenue by Division”, which illustrates Morgan Keegan’s revenues by division for the years ended
December 31, 2009, 2008 and 2007.
57