Regions Bank 2009 Annual Report Download - page 135
Download and view the complete annual report
Please find page 135 of the 2009 Regions Bank annual report below. You can navigate through the pages in the report by either clicking on the pages listed below, or by using the keyword search tool below to find specific information within the annual report.-
 1
1 -
2
-
3
-
4
-
5
-
6
-
7
-
8
-
9
-
10
-
11
-
12
-
13
-
14
-
15
-
16
-
17
-
18
-
19
-
20
-
21
-
22
-
23
-
24
-
25
-
26
-
27
-
28
-
29
-
30
-
31
-
32
-
33
-
34
-
35
-
36
-
37
-
38
-
39
-
40
-
41
-
42
-
43
-
44
-
45
-
46
-
47
-
48
-
49
-
50
-
51
-
52
-
53
-
54
-
55
-
56
-
57
-
58
-
59
-
60
-
61
-
62
-
63
-
64
-
65
-
66
-
67
-
68
-
69
-
70
-
71
-
72
-
73
-
74
-
75
-
76
-
77
-
78
-
79
-
80
-
81
-
82
-
83
-
84
-
85
-
86
-
87
-
88
-
89
-
90
-
91
-
92
-
93
-
94
-
95
-
96
-
97
-
98
-
99
-
100
-
101
-
102
-
103
-
104
-
105
-
106
-
107
-
108
-
109
-
110
-
111
-
112
-
113
-
114
-
115
-
116
-
117
-
118
-
119
-
120
-
121
-
122
-
123
-
124
-
 125
125 -
 126
126 -
 127
127 -
 128
128 -
 129
129 -
 130
130 -
 131
131 -
 132
132 -
 133
133 -
 134
134 -
 135
135 -
 136
136 -
 137
137 -
 138
138 -
 139
139 -
 140
140 -
 141
141 -
 142
142 -
 143
143 -
 144
144 -
 145
145 -
146
-
147
-
148
-
149
-
150
-
151
-
152
-
153
-
154
-
155
-
156
-
157
-
158
-
159
-
160
-
161
-
162
-
163
-
164
-
165
-
166
-
167
-
168
-
169
-
170
-
171
-
172
-
173
-
174
-
175
-
176
-
177
-
178
-
179
-
180
-
181
-
182
-
183
-
184
-
185
-
186
-
187
-
188
-
189
-
190
-
191
-
192
-
193
-
194
-
195
-
196
-
197
-
198
-
199
-
200
-
201
-
202
-
203
-
204
-
205
-
206
-
207
-
208
-
209
-
210
-
211
-
212
-
213
-
214
-
215
-
216
-
217
-
218
-
219
-
220
 |
 |
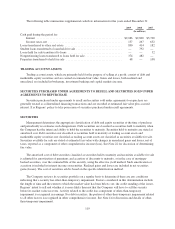
The allowance is maintained at a level believed adequate by management to absorb probable losses inherent
in the loan portfolio. Management’s determination of the adequacy of the allowance is a quarterly process and is
based on an evaluation of the loan portfolio, historical loan loss experience, current economic conditions,
collateral values of properties securing loans, volume, growth, quality and composition of the loan portfolio,
regulatory guidance, and other relevant factors. Unfavorable changes in any of these, or other factors, or the
availability of new information, could require that the allowance be adjusted in future periods. Actual losses
could vary from management’s estimates. No portion of the resulting allowance is allocated to any individual
credits or group of credits except for specific reserves required by authoritative accounting literature. The
remaining allowance is available to absorb losses from any and all loans.
Regions’ assessment of allowance levels is determined in accordance with GAAP and regulatory guidelines.
In determining the allowance, management uses information to stratify the loan portfolio into loan pools with
common risk characteristics. Loan pools in the portfolio are assigned estimated allowance amounts of loss based
on various factors and analyses, including but not limited to, current and historical loss experience trends and
levels of problem credits, current economic conditions, changes in product mix and underwriting. Loans deemed
to be impaired include non-accrual loans, excluding consumer loans, and troubled debt restructurings (“TDRs”).
Impaired loans, excluding consumer loans, with outstanding balances greater than $2.5 million are evaluated
individually rather than on a pool basis as described above. For these loans, Regions measures the level of
impairment based on the present value of the estimated projected cash flows, the estimated value of the collateral
or, if available, the observable market price. Regions generally uses the estimated projected cash flow method to
measure impairment. For consumer TDRs, Regions measures the level of impairment based on pools of loans
stratified by common risk characteristics.
In order to estimate a reserve for unfunded commitments, Regions uses a process consistent with that used
in developing the allowance for loan losses. Regions estimates future fundings, which are less than the total
unfunded commitment amounts, based on historical funding experience. Allowance for loan loss factors, which
are based on product and customer type and are consistent with the factors used for portfolio loans, are applied to
these funding estimates to arrive at the reserve balance. Changes in the reserve for unfunded commitments are
recognized in other non-interest expense.
ACCOUNTING FOR TRANSFERS AND SERVICING OF FINANCIAL ASSETS
Regions historically sold receivables, such as commercial loans, residential mortgage loans and dealer loans,
in securitizations and to third parties, including conduits. When Regions sold these receivables, it retained a
continuing interest in the form of interest-only strips, one or more subordinated tranches, servicing rights and/or
cash reserve accounts. These retained interests were initially recognized based on their respective allocated cost
basis on the date of transfer. Any gain or loss on the sale of the receivables depends in part on the previous
carrying amount of the financial assets involved in the transfer, allocated between the assets sold and the retained
interests based on their relative estimated fair value at the date of transfer. Retained interests in the subordinated
tranches and interest-only strips were recorded at fair value and included in securities available for sale.
Subsequent adjustments to fair value are recorded through other comprehensive income. Quoted market prices
for these assets are generally not available, so Regions estimates fair value based on the present value of
expected future cash flows using management’s best estimates of the key assumptions—expected credit losses,
prepayment speeds, weighted-average life, and discount rates commensurate with the inherent risks of the asset.
In calculating prepayment rates, Regions utilizes a variety of prepayment models depending on the loan type and
specific transaction requirements. The models used by Regions include the constant prepayment rate model
(CPR) and the Bond Market Trade Association’s Mortgaged Asset-Backed Securities Division’s prepayment
model (PSA). On a quarterly basis, Regions ensures that any retained interests are valued appropriately in the
consolidated financial statements. Management reviews the historical performance of each retained interest and
the assumptions used to project future cash flows. Assumptions are revised if past performance and future
expectations dictate. The present value of cash flows is then recalculated based on the revised assumptions. See
the “Future Application of Accounting Standards” section of Note 1 for further discussion of the impact of new
accounting literature on transfers of financial assets.
121