Regions Bank 2009 Annual Report Download - page 163
Download and view the complete annual report
Please find page 163 of the 2009 Regions Bank annual report below. You can navigate through the pages in the report by either clicking on the pages listed below, or by using the keyword search tool below to find specific information within the annual report.-
 1
1 -
2
-
3
-
4
-
5
-
6
-
7
-
8
-
9
-
10
-
11
-
12
-
13
-
14
-
15
-
16
-
17
-
18
-
19
-
20
-
21
-
22
-
23
-
24
-
25
-
26
-
27
-
28
-
29
-
30
-
31
-
32
-
33
-
34
-
35
-
36
-
37
-
38
-
39
-
40
-
41
-
42
-
43
-
44
-
45
-
46
-
47
-
48
-
49
-
50
-
51
-
52
-
53
-
54
-
55
-
56
-
57
-
58
-
59
-
60
-
61
-
62
-
63
-
64
-
65
-
66
-
67
-
68
-
69
-
70
-
71
-
72
-
73
-
74
-
75
-
76
-
77
-
78
-
79
-
80
-
81
-
82
-
83
-
84
-
85
-
86
-
87
-
88
-
89
-
90
-
91
-
92
-
93
-
94
-
95
-
96
-
97
-
98
-
99
-
100
-
101
-
102
-
103
-
104
-
105
-
106
-
107
-
108
-
109
-
110
-
111
-
112
-
113
-
114
-
115
-
116
-
117
-
118
-
119
-
120
-
121
-
122
-
123
-
124
-
125
-
126
-
127
-
128
-
129
-
130
-
131
-
132
-
133
-
134
-
135
-
136
-
137
-
138
-
139
-
140
-
141
-
142
-
143
-
144
-
145
-
146
-
147
-
148
-
149
-
150
-
151
-
152
-
 153
153 -
 154
154 -
 155
155 -
 156
156 -
 157
157 -
 158
158 -
 159
159 -
 160
160 -
 161
161 -
 162
162 -
 163
163 -
 164
164 -
 165
165 -
 166
166 -
 167
167 -
 168
168 -
 169
169 -
 170
170 -
 171
171 -
 172
172 -
 173
173 -
174
-
175
-
176
-
177
-
178
-
179
-
180
-
181
-
182
-
183
-
184
-
185
-
186
-
187
-
188
-
189
-
190
-
191
-
192
-
193
-
194
-
195
-
196
-
197
-
198
-
199
-
200
-
201
-
202
-
203
-
204
-
205
-
206
-
207
-
208
-
209
-
210
-
211
-
212
-
213
-
214
-
215
-
216
-
217
-
218
-
219
-
220
 |
 |

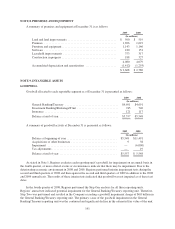
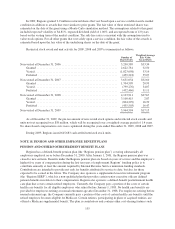
In addition, Regions must adhere to various U.S. Department of Housing and Urban Development (“HUD”)
regulatory guidelines including required minimum capital to maintain their Federal Housing Administration
approved status. Failure to comply with the HUD guidelines could result in withdrawal of this certification. As of
December 31, 2009, Regions was in compliance with HUD guidelines. Regions is also subject to various capital
requirements by secondary market investors.
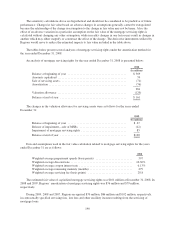
NOTE 15. STOCKHOLDERS’ EQUITY AND COMPREHENSIVE INCOME (LOSS)
On November 14, 2008, Regions completed the sale of 3.5 million shares of its Fixed Rate Cumulative
Perpetual Preferred Stock, Series A, par value $1.00 and liquidation preference $1,000.00 per share (and $3.5
billion liquidation preference in the aggregate) to the U.S. Treasury as part of the Capital Purchase Program
(“CPP”). Regions will pay the U.S. Treasury on a quarterly basis a 5% dividend, or $175 million annually, for
each of the first five years of the investment, and 9% thereafter unless Regions redeems the shares. Regions
performed a discounted cash flow analysis to value the preferred stock at the date of issuance. For purposes of
this analysis, Regions assumed that the preferred stock would most likely be redeemed five years from the
valuation date based on optimal financial budgeting considerations. Regions used the Bloomberg USD US Bank
BBB index to derive the market yield curve as of the valuation date to discount future expected cash flows to the
valuation date. The discount rate used to value the preferred stock was 7.46%, based on this yield curve at a
5-year maturity. Dividends were assumed to be accrued until redemption. While the discounting was required
based on a 5-year redemption, Regions did not have a 5-year security or similarly termed security available. As a
result, it was necessary to use a benchmark yield curve to calculate the 5-year value. To determine the
appropriate yield curve that was applicable to Regions, the yield to maturity on the outstanding debt instrument
with the longest dated maturity (8.875% junior subordinated notes due June 2048) was compared to the longest
point on the USD US Bank BBB index as of November 14, 2008. Regions concluded that the yield to maturity as
of the valuation date of the debt, which was 11.03%, was consistent with the indicative yield of the curve noted
above. The longest available point on this curve was 10.55% at 30 years.
As part of its purchase of the preferred securities, the U.S. Treasury also received a warrant to purchase
48.3 million shares of Regions’ common stock at an exercise price of $10.88 per share, subject to anti-dilution
and other adjustments. The warrant expires ten years from the issuance date. Regions used the Cox-Ross-
Rubinstein Binomial Option Pricing Model (“CRR Model”) to value the warrant at the date of issuance. The
CRR Model is a standard option pricing model which incorporates optimal early exercise in order to receive the
benefit of future dividend payments. Based on the transferability of the warrant, the CRR Model approach that
was applied assumes that the warrant holder will not sub-optimally exercise its warrant. The following
assumptions were used in the CRR Model:
Stock price(a) ............................................................... $ 9.67
Exercise price(b) ............................................................ $10.88
Expected volatility(c) ......................................................... 45.22%
Risk-free rate(d) ............................................................. 4.25%
Dividend yield(e) ............................................................ 3.88%
Warrant term (in years)(b) ..................................................... 10
(a) Closing stock price of Regions as of the valuation date (November 14, 2008).
(b) As outlined in the Warrant to Purchase Agreement, dated November 14, 2008.
(c) Expected volatility based on Regions’ historical volatility, as of November 14, 2008, over a look-back
period of 10 years, commensurate with the terms of the warrant.
(d) The risk-free rate represents the yield on 10-year U.S. Treasury Strips as of November 14, 2008.
(e) The dividend yield assumption was calculated based on a weighting of 30% on management’s dividend
yield expectations for the next 3 years and a weighting of 70% on Regions’ average dividend yield over the
10 years prior to the valuation date.
149