Regions Bank 2009 Annual Report Download - page 74
Download and view the complete annual report
Please find page 74 of the 2009 Regions Bank annual report below. You can navigate through the pages in the report by either clicking on the pages listed below, or by using the keyword search tool below to find specific information within the annual report.-
 1
1 -
2
-
3
-
4
-
5
-
6
-
7
-
8
-
9
-
10
-
11
-
12
-
13
-
14
-
15
-
16
-
17
-
18
-
19
-
20
-
21
-
22
-
23
-
24
-
25
-
26
-
27
-
28
-
29
-
30
-
31
-
32
-
33
-
34
-
35
-
36
-
37
-
38
-
39
-
40
-
41
-
42
-
43
-
44
-
45
-
46
-
47
-
48
-
49
-
50
-
51
-
52
-
53
-
54
-
55
-
56
-
57
-
58
-
59
-
60
-
61
-
62
-
63
-
 64
64 -
 65
65 -
 66
66 -
 67
67 -
 68
68 -
 69
69 -
 70
70 -
 71
71 -
 72
72 -
 73
73 -
 74
74 -
 75
75 -
 76
76 -
 77
77 -
 78
78 -
 79
79 -
 80
80 -
 81
81 -
 82
82 -
 83
83 -
 84
84 -
85
-
86
-
87
-
88
-
89
-
90
-
91
-
92
-
93
-
94
-
95
-
96
-
97
-
98
-
99
-
100
-
101
-
102
-
103
-
104
-
105
-
106
-
107
-
108
-
109
-
110
-
111
-
112
-
113
-
114
-
115
-
116
-
117
-
118
-
119
-
120
-
121
-
122
-
123
-
124
-
125
-
126
-
127
-
128
-
129
-
130
-
131
-
132
-
133
-
134
-
135
-
136
-
137
-
138
-
139
-
140
-
141
-
142
-
143
-
144
-
145
-
146
-
147
-
148
-
149
-
150
-
151
-
152
-
153
-
154
-
155
-
156
-
157
-
158
-
159
-
160
-
161
-
162
-
163
-
164
-
165
-
166
-
167
-
168
-
169
-
170
-
171
-
172
-
173
-
174
-
175
-
176
-
177
-
178
-
179
-
180
-
181
-
182
-
183
-
184
-
185
-
186
-
187
-
188
-
189
-
190
-
191
-
192
-
193
-
194
-
195
-
196
-
197
-
198
-
199
-
200
-
201
-
202
-
203
-
204
-
205
-
206
-
207
-
208
-
209
-
210
-
211
-
212
-
213
-
214
-
215
-
216
-
217
-
218
-
219
-
220
 |
 |
Gain on Early Extinguishment of Debt
During 2009, Regions completed an exchange of common shares for outstanding 6.625% Trust Preferred
Securities issued by Regions Financing Trust II (“the Trust”). In connection with this exchange, the Company
recognized a gain on extinguishment of junior subordinated debt issued to the Trust. The extinguishment resulted
in an increase to non-interest income of $61 million in 2009. For further details, see Note 15 “Stockholders’
Equity and Comprehensive Income (Loss)” to the consolidated financial statements.
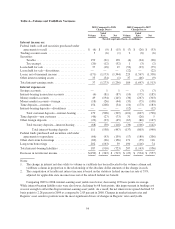
Visa-related Gains
In early 2008, Visa executed an initial public offering (IPO) of common stock and, in connection with the
IPO, Regions’ ownership interest in Visa was converted into approximately 3.8 million shares of Class B
common stock. In late 2008, Regions recognized a $63 million gain upon the redemption of these shares. In
2009, Regions sold its remaining Visa Class B common stock resulting in an $80 million gain.
Bank-Owned Life Insurance
Bank-owned life insurance income decreased 5 percent to $74 million in 2009, compared to $78 million in
2008. This decrease is primarily due to lower crediting rates caused by declines in the financial markets.
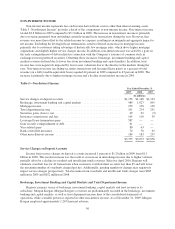
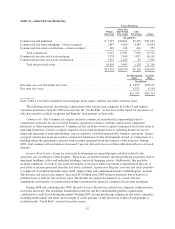
NON-INTEREST EXPENSE
The following section contains a discussion of non-interest expense from continuing operations. The largest
components of non-interest expense are salaries and employee benefits, net occupancy expense and furniture and
equipment expense. Non-interest expense in 2008 included a $6.0 billion non-cash goodwill impairment charge
and merger-related charges totaling $201 million. Non-interest expense, excluding the merger-related and
goodwill impairment charges, increased $160 million, or 3 percent, to $4.8 billion in 2009.
During the fourth quarter of 2009, Regions announced plans to consolidate 121 branches during the first
quarter of 2010. The decision to consolidate these branches was based largely on their proximity to other
branches and an opportunity for combined performance improvement. Costs associated with these consolidations
totaled approximately $53 million dollars in 2009.
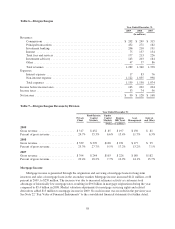
Table 9 “Non-Interest Expense (including Non-GAAP reconciliation)” presents major non-interest expense
components, both including and excluding merger-related charges and goodwill impairment, for the years ended
December 31, 2009, 2008 and 2007. Management believes Table 9 is useful in evaluating trends in non-interest
expense. Note that merger-related charges as shown in this table relate to Regions’ acquisition of AmSouth in
November 2006. See Table 2 “GAAP to Non-GAAP Reconciliation,” and the text preceding it, for further
discussion of non-GAAP financial measures.
60