Regions Bank 2009 Annual Report Download - page 107
Download and view the complete annual report
Please find page 107 of the 2009 Regions Bank annual report below. You can navigate through the pages in the report by either clicking on the pages listed below, or by using the keyword search tool below to find specific information within the annual report.-
 1
1 -
2
-
3
-
4
-
5
-
6
-
7
-
8
-
9
-
10
-
11
-
12
-
13
-
14
-
15
-
16
-
17
-
18
-
19
-
20
-
21
-
22
-
23
-
24
-
25
-
26
-
27
-
28
-
29
-
30
-
31
-
32
-
33
-
34
-
35
-
36
-
37
-
38
-
39
-
40
-
41
-
42
-
43
-
44
-
45
-
46
-
47
-
48
-
49
-
50
-
51
-
52
-
53
-
54
-
55
-
56
-
57
-
58
-
59
-
60
-
61
-
62
-
63
-
64
-
65
-
66
-
67
-
68
-
69
-
70
-
71
-
72
-
73
-
74
-
75
-
76
-
77
-
78
-
79
-
80
-
81
-
82
-
83
-
84
-
85
-
86
-
87
-
88
-
89
-
90
-
91
-
92
-
93
-
94
-
95
-
96
-
 97
97 -
 98
98 -
 99
99 -
 100
100 -
 101
101 -
 102
102 -
 103
103 -
 104
104 -
 105
105 -
 106
106 -
 107
107 -
 108
108 -
 109
109 -
 110
110 -
 111
111 -
 112
112 -
 113
113 -
 114
114 -
 115
115 -
 116
116 -
 117
117 -
118
-
119
-
120
-
121
-
122
-
123
-
124
-
125
-
126
-
127
-
128
-
129
-
130
-
131
-
132
-
133
-
134
-
135
-
136
-
137
-
138
-
139
-
140
-
141
-
142
-
143
-
144
-
145
-
146
-
147
-
148
-
149
-
150
-
151
-
152
-
153
-
154
-
155
-
156
-
157
-
158
-
159
-
160
-
161
-
162
-
163
-
164
-
165
-
166
-
167
-
168
-
169
-
170
-
171
-
172
-
173
-
174
-
175
-
176
-
177
-
178
-
179
-
180
-
181
-
182
-
183
-
184
-
185
-
186
-
187
-
188
-
189
-
190
-
191
-
192
-
193
-
194
-
195
-
196
-
197
-
198
-
199
-
200
-
201
-
202
-
203
-
204
-
205
-
206
-
207
-
208
-
209
-
210
-
211
-
212
-
213
-
214
-
215
-
216
-
217
-
218
-
219
-
220
 |
 |

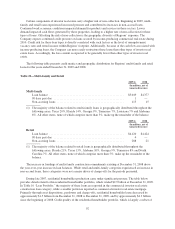
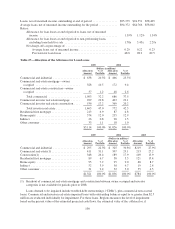
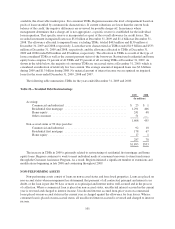
the commercial investor real estate construction portfolio, is sensitive to risks associated with construction loans
such as cost overruns, project completion risk, general contractor credit risk, environmental and other hazard
risks, and market risks associated with the sale or rental of completed properties. While losses within this loan
type were influenced by conditions described above, the most significant driver of losses was the severe decline
in demand for residential real estate. In late 2009, the migration of residential homebuilder loans into the
non-performing category slowed; however, credit losses for this portfolio are expected to continue at current
levels.
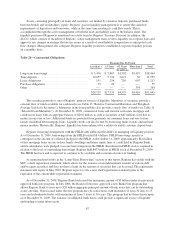
Table 23—Residential Homebuilder
December 31, 2009
Loan
Balance
Year-to-Date
Net Charge-Offs
90 Days
Past Due
Non-Accruing
Loans
(In millions, net of unearned income)
Land .............................................. $ 952 $162 $ 2 $295
Residential—spec .................................... 851 78 3 229
Residential—presold ................................. 168 24 1 96
Lots ............................................... 714 113 12 219
National homebuilders and other ........................ 183 24 — 126
$2,868 $401 $ 18 $965
December 31, 2008
Loan
Balance
Year-to-Date
Net Charge-Offs
90 Days
Past Due
Non-Accruing
Loans
(In millions, net of unearned income)
Land .............................................. $1,553 $175 $ 6 $ 89
Residential—spec .................................... 1,297 126 7 110
Residential—presold ................................. 300 55 — 11
Lots ............................................... 967 112 4 58
National homebuilders and other ........................ 285 30 — 28
$4,402 $498 $ 17 $296
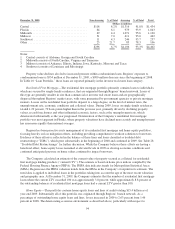
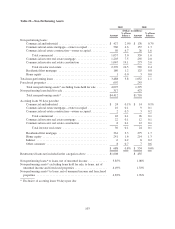
The following table provides detail related to the geographic breakout and performing status of residential
homebuilder loans:
Table 24—Geographic Breakout of Residential Homebuilder
December 31, 2009 Non-Accruing % of Total Accruing % of Total Total
(Dollars in millions)
Central ....................................... $264 29.7% $ 624 70.3% $ 888
Florida ....................................... 250 35.6 453 64.4 703
Midsouth ..................................... 335 37.4 561 62.6 896
Southwest .................................... 82 26.3 230 73.7 312
Other ........................................ 34 49.3 35 50.7 69
$965 33.6% $1,903 66.4% $2,868
Notes:
1 Central consists of Alabama, Georgia and South Carolina
2 Midsouth consists of North Carolina, Virginia, Tennessee, Indiana, Illinois, Missouri, Iowa and Kentucky
3 Southwest consists of Louisiana, Mississippi, Texas and Arkansas
93