Regions Bank 2009 Annual Report Download - page 181
Download and view the complete annual report
Please find page 181 of the 2009 Regions Bank annual report below. You can navigate through the pages in the report by either clicking on the pages listed below, or by using the keyword search tool below to find specific information within the annual report.-
 1
1 -
2
-
3
-
4
-
5
-
6
-
7
-
8
-
9
-
10
-
11
-
12
-
13
-
14
-
15
-
16
-
17
-
18
-
19
-
20
-
21
-
22
-
23
-
24
-
25
-
26
-
27
-
28
-
29
-
30
-
31
-
32
-
33
-
34
-
35
-
36
-
37
-
38
-
39
-
40
-
41
-
42
-
43
-
44
-
45
-
46
-
47
-
48
-
49
-
50
-
51
-
52
-
53
-
54
-
55
-
56
-
57
-
58
-
59
-
60
-
61
-
62
-
63
-
64
-
65
-
66
-
67
-
68
-
69
-
70
-
71
-
72
-
73
-
74
-
75
-
76
-
77
-
78
-
79
-
80
-
81
-
82
-
83
-
84
-
85
-
86
-
87
-
88
-
89
-
90
-
91
-
92
-
93
-
94
-
95
-
96
-
97
-
98
-
99
-
100
-
101
-
102
-
103
-
104
-
105
-
106
-
107
-
108
-
109
-
110
-
111
-
112
-
113
-
114
-
115
-
116
-
117
-
118
-
119
-
120
-
121
-
122
-
123
-
124
-
125
-
126
-
127
-
128
-
129
-
130
-
131
-
132
-
133
-
134
-
135
-
136
-
137
-
138
-
139
-
140
-
141
-
142
-
143
-
144
-
145
-
146
-
147
-
148
-
149
-
150
-
151
-
152
-
153
-
154
-
155
-
156
-
157
-
158
-
159
-
160
-
161
-
162
-
163
-
164
-
165
-
166
-
167
-
168
-
169
-
170
-
 171
171 -
 172
172 -
 173
173 -
 174
174 -
 175
175 -
 176
176 -
 177
177 -
 178
178 -
 179
179 -
 180
180 -
 181
181 -
 182
182 -
 183
183 -
 184
184 -
 185
185 -
 186
186 -
 187
187 -
 188
188 -
 189
189 -
 190
190 -
 191
191 -
192
-
193
-
194
-
195
-
196
-
197
-
198
-
199
-
200
-
201
-
202
-
203
-
204
-
205
-
206
-
207
-
208
-
209
-
210
-
211
-
212
-
213
-
214
-
215
-
216
-
217
-
218
-
219
-
220
 |
 |
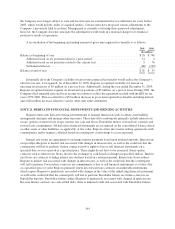
comparing the change in fair value of the respective derivative instrument and the change in fair value of a
“perfectly effective” hypothetical derivative instrument. Ineffectiveness will be recognized in earnings only if it
results from an overhedge. The ineffective portion of the gain or loss related to the derivative instrument, if any,
is recognized in the statement of operations as other non-interest expense during the period of change. Amounts
recorded in accumulated other comprehensive income are recognized in earnings in the period or periods during
which the hedged item impacts earnings.
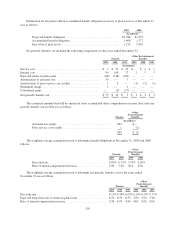
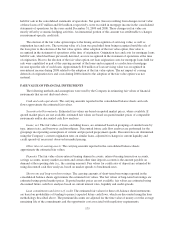
Regions enters into interest rate swap agreements to manage overall cash flow changes related to interest
rate risk exposure on LIBOR-based loans. The agreements effectively modify the Company’s exposure to interest
rate risk by utilizing receive fixed/pay LIBOR interest rate swaps. As of December 31, 2009, the total notional
amount of the Company’s interest rate swaps hedging cash flows on LIBOR-based loans was $4.3 billion.
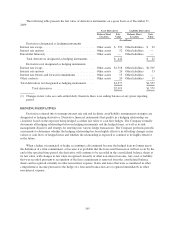
Regions issues long-term fixed-rate debt for various funding needs. Regions enters into receive LIBOR/pay-
fixed forward starting swaps to hedge risks of changes in the projected quarterly interest payments attributable to
changes in the benchmark interest rate (LIBOR) during the time leading up to the probable issuance date of the
new long term fixed-rate debt. As of December 31, 2009, the total notional amount of the Company’s forward-
starting swaps was $1.0 billion.
Regions enters into interest rate option contracts to protect cash flows through the maturity date of the
hedging instrument on designated one-month LIBOR floating-rate loans from adverse extreme market interest
rate changes. As of December 31, 2009, the total notional amount of the Company’s interest rate options was
$2.0 billion.
Regions purchases Eurodollar futures to hedge the variability in future cash flows based on forecasted resets
of one-month LIBOR-based floating rate loans due to changes in the benchmark interest rate. As of
December 31, 2009, the total notional amount of the Company’s Eurodollar futures was $30.2 billion.
Regions entered into interest rate swap agreements to manage overall cash flow changes related to interest
rate risk exposure on prime-based loans. The agreements effectively modified the Company’s exposure to
interest rate risk by utilizing receive fixed/pay prime interest rate swaps. As of December 31, 2009, Regions had
no active hedges on prime-based loans.
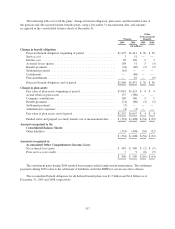
Regions realized an after-tax benefit of $13 million in accumulated other comprehensive income at
December 31, 2009, related to terminated cash flow hedges of loan and debt instruments which will be amortized
into earnings in conjunction with the recognition of interest payments through 2012. Regions recognized pre-tax
income of $39 million during 2009 related to this amortization.
Regions expects to reclassify out of other comprehensive income and into earnings approximately $189
million in pre-tax income due to the receipt of interest payments on all cash flow hedges within the next twelve
months. Of this amount, $19 million relates to the amortization of discontinued cash flow hedges. The maximum
length of time over which Regions is hedging its exposure to the variability in future cash flows for forecasted
transactions is approximately two years as of December 31, 2009.
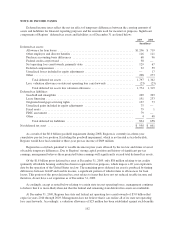
TRADING DERIVATIVES
Derivative contracts that do not qualify for hedge accounting are classified as trading with gains and losses
related to the change in fair value recognized in the statement of operations during the period.
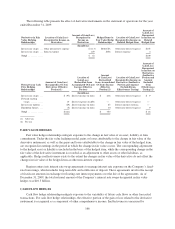
The Company maintains a derivatives trading portfolio of interest rate swaps, option contracts, and futures
and forward commitments used to meet the needs of its customers. The portfolio is used to generate trading profit
and to help clients manage market risk. The Company is subject to the credit risk that a counterparty will fail to
perform. The Company is also subject to market risk, which is evaluated by the Company and monitored by the
167