Regions Bank 2009 Annual Report Download - page 76
Download and view the complete annual report
Please find page 76 of the 2009 Regions Bank annual report below. You can navigate through the pages in the report by either clicking on the pages listed below, or by using the keyword search tool below to find specific information within the annual report.-
 1
1 -
2
-
3
-
4
-
5
-
6
-
7
-
8
-
9
-
10
-
11
-
12
-
13
-
14
-
15
-
16
-
17
-
18
-
19
-
20
-
21
-
22
-
23
-
24
-
25
-
26
-
27
-
28
-
29
-
30
-
31
-
32
-
33
-
34
-
35
-
36
-
37
-
38
-
39
-
40
-
41
-
42
-
43
-
44
-
45
-
46
-
47
-
48
-
49
-
50
-
51
-
52
-
53
-
54
-
55
-
56
-
57
-
58
-
59
-
60
-
61
-
62
-
63
-
64
-
65
-
 66
66 -
 67
67 -
 68
68 -
 69
69 -
 70
70 -
 71
71 -
 72
72 -
 73
73 -
 74
74 -
 75
75 -
 76
76 -
 77
77 -
 78
78 -
 79
79 -
 80
80 -
 81
81 -
 82
82 -
 83
83 -
 84
84 -
 85
85 -
 86
86 -
87
-
88
-
89
-
90
-
91
-
92
-
93
-
94
-
95
-
96
-
97
-
98
-
99
-
100
-
101
-
102
-
103
-
104
-
105
-
106
-
107
-
108
-
109
-
110
-
111
-
112
-
113
-
114
-
115
-
116
-
117
-
118
-
119
-
120
-
121
-
122
-
123
-
124
-
125
-
126
-
127
-
128
-
129
-
130
-
131
-
132
-
133
-
134
-
135
-
136
-
137
-
138
-
139
-
140
-
141
-
142
-
143
-
144
-
145
-
146
-
147
-
148
-
149
-
150
-
151
-
152
-
153
-
154
-
155
-
156
-
157
-
158
-
159
-
160
-
161
-
162
-
163
-
164
-
165
-
166
-
167
-
168
-
169
-
170
-
171
-
172
-
173
-
174
-
175
-
176
-
177
-
178
-
179
-
180
-
181
-
182
-
183
-
184
-
185
-
186
-
187
-
188
-
189
-
190
-
191
-
192
-
193
-
194
-
195
-
196
-
197
-
198
-
199
-
200
-
201
-
202
-
203
-
204
-
205
-
206
-
207
-
208
-
209
-
210
-
211
-
212
-
213
-
214
-
215
-
216
-
217
-
218
-
219
-
220
 |
 |
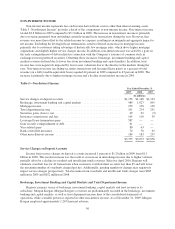
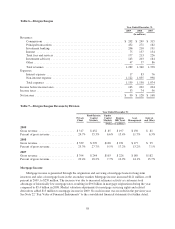
Salaries and Employee Benefits
Total salaries and employee benefits decreased $87 million, or 4 percent, in 2009. Included in total salaries
and employee benefits are merger charges totaling $134 million in 2008. The year-over-year decrease in salaries
and employee benefits cost is the due to the 2008 merger charges and a 7 percent decline in headcount. At
December 31, 2009, Regions had 28,509 employees compared to 30,784 at December 31, 2008.
Regions provides employees who meet established employment requirements with a benefits package that
includes 401(k), pension, and medical, life and disability insurance plans. New enrollment in the Regions pension
plan ended effective December 31, 2000. New enrollment in the legacy AmSouth pension plan ended effective
with the merger date, November 4, 2006. Former AmSouth employees enrolled as of November 4, 2006 continue
to be active in the plan, but no additional participants will be added. Effective September 30, 2007, the two
pension plans merged into one plan. Regions’ 401(k) plan includes a company match of eligible employee
contributions. The Company temporarily suspended the pension service credit and the company match for
eligible employee contributions in early 2009; however, the Company announced that these will be restored
beginning in January 2010. The temporary suspensions contributed to the decrease in salaries and employee
benefits in 2009 as compared to 2008. See Note 18 “Pension and Other Employee Benefit Plans” to the
consolidated financial statements for further details.
There are various incentive plans in place in many of Regions’ lines of business that are tied to the
performance levels of employees. At Morgan Keegan, commissions and incentives are a key component of
compensation, which is typical in the brokerage and investment banking industry. In general, incentives are used
to reward employees for selling products and services, for productivity improvements and for achievement of
corporate financial goals. These achievements are determined through a review of profitability versus risk
management. Regions’ long-term incentive plan provides for the granting of stock options, restricted stock,
restricted stock units and performance shares. See Note 17 “Share-Based Payments” to the consolidated financial
statements for further information.
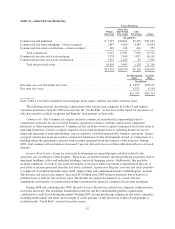
Net Occupancy Expense
Net occupancy expense includes rents, depreciation and amortization, utilities, maintenance, insurance,
taxes, and other expenses of premises occupied by Regions and its affiliates. Occupancy expense increased $12
million, or 3 percent, in 2009 primarily due to charges associated with the 2009 decision to consolidate 121
branches. Also, included in net occupancy expense in 2008 were merger charges of $4 million, reflecting costs to
vacate leases due to the merger.
Furniture and Equipment Expense
Furniture and equipment expense decreased $24 million to $311 million in 2009. This decrease is primarily
due to lower depreciation, however 2009 branch consolidation charges of $7 million partially offset the
decreases. Included in furniture and equipment expense were merger charges of $5 million in 2008.
Professional and Legal Fees
Professional and legal fees are comprised of amounts related to legal, consulting and other professional fees.
These fees increased $95 million to $309 million in 2009. Included in professional fees during 2008 were $7
million of merger-related charges. The increase in 2009 is primarily due to higher legal expenses incurred at
Morgan Keegan and credit-related legal costs (such as legal fees associated with loan work-outs). Refer to Note
24 “Commitments, Contingencies and Guarantees” to the consolidated financial statements for additional
information.
62