Regions Bank 2009 Annual Report Download - page 166
Download and view the complete annual report
Please find page 166 of the 2009 Regions Bank annual report below. You can navigate through the pages in the report by either clicking on the pages listed below, or by using the keyword search tool below to find specific information within the annual report.-
 1
1 -
2
-
3
-
4
-
5
-
6
-
7
-
8
-
9
-
10
-
11
-
12
-
13
-
14
-
15
-
16
-
17
-
18
-
19
-
20
-
21
-
22
-
23
-
24
-
25
-
26
-
27
-
28
-
29
-
30
-
31
-
32
-
33
-
34
-
35
-
36
-
37
-
38
-
39
-
40
-
41
-
42
-
43
-
44
-
45
-
46
-
47
-
48
-
49
-
50
-
51
-
52
-
53
-
54
-
55
-
56
-
57
-
58
-
59
-
60
-
61
-
62
-
63
-
64
-
65
-
66
-
67
-
68
-
69
-
70
-
71
-
72
-
73
-
74
-
75
-
76
-
77
-
78
-
79
-
80
-
81
-
82
-
83
-
84
-
85
-
86
-
87
-
88
-
89
-
90
-
91
-
92
-
93
-
94
-
95
-
96
-
97
-
98
-
99
-
100
-
101
-
102
-
103
-
104
-
105
-
106
-
107
-
108
-
109
-
110
-
111
-
112
-
113
-
114
-
115
-
116
-
117
-
118
-
119
-
120
-
121
-
122
-
123
-
124
-
125
-
126
-
127
-
128
-
129
-
130
-
131
-
132
-
133
-
134
-
135
-
136
-
137
-
138
-
139
-
140
-
141
-
142
-
143
-
144
-
145
-
146
-
147
-
148
-
149
-
150
-
151
-
152
-
153
-
154
-
155
-
 156
156 -
 157
157 -
 158
158 -
 159
159 -
 160
160 -
 161
161 -
 162
162 -
 163
163 -
 164
164 -
 165
165 -
 166
166 -
 167
167 -
 168
168 -
 169
169 -
 170
170 -
 171
171 -
 172
172 -
 173
173 -
 174
174 -
 175
175 -
 176
176 -
177
-
178
-
179
-
180
-
181
-
182
-
183
-
184
-
185
-
186
-
187
-
188
-
189
-
190
-
191
-
192
-
193
-
194
-
195
-
196
-
197
-
198
-
199
-
200
-
201
-
202
-
203
-
204
-
205
-
206
-
207
-
208
-
209
-
210
-
211
-
212
-
213
-
214
-
215
-
216
-
217
-
218
-
219
-
220
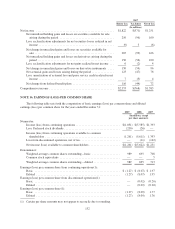
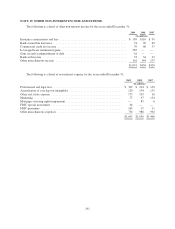
 |
 |

2007
Before Tax Tax Effect Net of Tax
(In millions)
Net income ..................................................... $1,822 $(571) $1,251
Net unrealized holding gains and losses on securities available for sale
arising during the period ..................................... 256 (96) 160
Less: reclassification adjustments for net securities losses realized in net
income ................................................... (9) 3 (6)
Net change in unrealized gains and losses on securities available for
sale ...................................................... 265 (99) 166
Net unrealized holding gains and losses on derivatives arising during the
period .................................................... 156 (56) 100
Less: reclassification adjustments for net gains realized in net income . . . 6 (2) 4
Net change in unrealized gains and losses on derivative instruments .... 150 (54) 96
Net actuarial gains and losses arising during the period ............... 123 (47) 76
Less: amortization of actuarial loss and prior service credit realized in net
income ................................................... 7 (3) 4
Net change from defined benefit plans ............................ 116 (44) 72
Comprehensive income ............................................ $2,353 $(768) $1,585
NOTE 16. EARNINGS (LOSS) PER COMMON SHARE
The following table sets forth the computation of basic earnings (loss) per common share and diluted
earnings (loss) per common share for the years ended December 31:
2009 2008 2007
(In millions, except
per share amounts)
Numerator:
Income (loss) from continuing operations .............................. $(1,031) $(5,585) $1,393
Less: Preferred stock dividends ...................................... (230) (26) —
Income (loss) from continuing operations available to common
shareholders ................................................... (1,261) (5,611) 1,393
Loss from discontinued operations, net of tax ........................... — (11) (142)
Net income (loss) available to common shareholders ..................... $(1,261) $(5,622) $1,251
Denominator:
Weighted-average common shares outstanding—basic ................... 989 695 708
Common stock equivalents ......................................... — — 5
Weighted-average common shares outstanding—diluted .................. 989 695 713
Earnings (loss) per common share from continuing operations(1):
Basic .......................................................... $ (1.27) $ (8.07) $ 1.97
Diluted ......................................................... (1.27) (8.07) 1.95
Earnings (loss) per common share from discontinued operations(1):
Basic .......................................................... — (0.02) (0.20)
Diluted ......................................................... — (0.02) (0.20)
Earnings (loss) per common share(1):
Basic .......................................................... (1.27) (8.09) 1.77
Diluted ......................................................... (1.27) (8.09) 1.76
(1) Certain per share amounts may not appear to reconcile due to rounding.
152