Regions Bank 2009 Annual Report Download - page 176
Download and view the complete annual report
Please find page 176 of the 2009 Regions Bank annual report below. You can navigate through the pages in the report by either clicking on the pages listed below, or by using the keyword search tool below to find specific information within the annual report.-
 1
1 -
2
-
3
-
4
-
5
-
6
-
7
-
8
-
9
-
10
-
11
-
12
-
13
-
14
-
15
-
16
-
17
-
18
-
19
-
20
-
21
-
22
-
23
-
24
-
25
-
26
-
27
-
28
-
29
-
30
-
31
-
32
-
33
-
34
-
35
-
36
-
37
-
38
-
39
-
40
-
41
-
42
-
43
-
44
-
45
-
46
-
47
-
48
-
49
-
50
-
51
-
52
-
53
-
54
-
55
-
56
-
57
-
58
-
59
-
60
-
61
-
62
-
63
-
64
-
65
-
66
-
67
-
68
-
69
-
70
-
71
-
72
-
73
-
74
-
75
-
76
-
77
-
78
-
79
-
80
-
81
-
82
-
83
-
84
-
85
-
86
-
87
-
88
-
89
-
90
-
91
-
92
-
93
-
94
-
95
-
96
-
97
-
98
-
99
-
100
-
101
-
102
-
103
-
104
-
105
-
106
-
107
-
108
-
109
-
110
-
111
-
112
-
113
-
114
-
115
-
116
-
117
-
118
-
119
-
120
-
121
-
122
-
123
-
124
-
125
-
126
-
127
-
128
-
129
-
130
-
131
-
132
-
133
-
134
-
135
-
136
-
137
-
138
-
139
-
140
-
141
-
142
-
143
-
144
-
145
-
146
-
147
-
148
-
149
-
150
-
151
-
152
-
153
-
154
-
155
-
156
-
157
-
158
-
159
-
160
-
161
-
162
-
163
-
164
-
165
-
 166
166 -
 167
167 -
 168
168 -
 169
169 -
 170
170 -
 171
171 -
 172
172 -
 173
173 -
 174
174 -
 175
175 -
 176
176 -
 177
177 -
 178
178 -
 179
179 -
 180
180 -
 181
181 -
 182
182 -
 183
183 -
 184
184 -
 185
185 -
 186
186 -
187
-
188
-
189
-
190
-
191
-
192
-
193
-
194
-
195
-
196
-
197
-
198
-
199
-
200
-
201
-
202
-
203
-
204
-
205
-
206
-
207
-
208
-
209
-
210
-
211
-
212
-
213
-
214
-
215
-
216
-
217
-
218
-
219
-
220
 |
 |

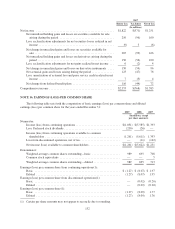
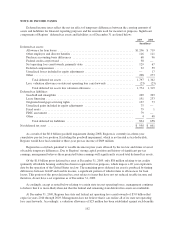
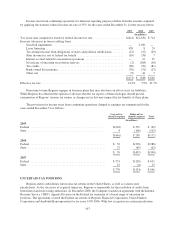
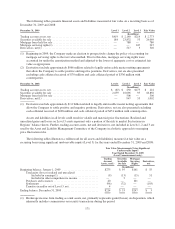
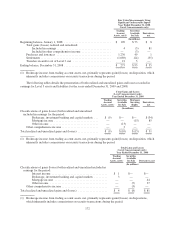
NOTE 20. INCOME TAXES
Deferred income taxes reflect the net tax effect of temporary differences between the carrying amounts of
assets and liabilities for financial reporting purposes and the amounts used for income tax purposes. Significant
components of Regions’ deferred tax assets and liabilities as of December 31 are listed below:
2009 2008
(In millions)
Deferred tax assets:
Allowance for loan losses ................................................... $1,206 $ 719
Other employee and director benefits .......................................... 116 111
Purchase accounting basis differences ......................................... 68 96
Federal credit carryforward .................................................. 38 —
Net operating loss carryfowards, primarily state ................................. 129 67
Deferred compensation ..................................................... 32 59
Unrealized losses included in equity adjustments ................................. — 17
Other ................................................................... 208 273
Total deferred tax assets ................................................ 1,797 1,342
Less: valuation allowance on state net operating loss carryforwards .................. (23) (23)
Total deferred tax assets less valuation allowance ............................ 1,774 1,319
Deferred tax liabilities:
Goodwill and intangibles ................................................... 269 303
Lease financing ........................................................... 191 233
Originated mortgage servicing rights .......................................... 127 73
Unrealized gains included in equity adjustments ................................. 75 —
Fixed assets .............................................................. 79 1
FDIC assessment .......................................................... 79 —
Other ................................................................... 4 48
Total deferred tax liabilities ............................................. 824 658
Net deferred tax asset .......................................................... $ 950 $ 661
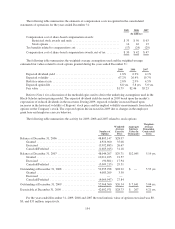
As a result of the $6.0 billion goodwill impairment during 2008, Regions is currently in a three-year
cumulative pre-tax loss position. Excluding the goodwill impairment, which is not treated as tax deductible,
Regions would have had cumulative three-year pre-tax income of $669 million.
Regions has carryback potential to taxable income in prior years allowed by the tax law and future reversal
of taxable temporary differences. Due to Regions’ strong capital position and history of significant pre-tax
earnings, management believes these projected future earnings will significantly exceed total deferred tax assets.
Of the $1.8 billion gross deferred tax asset at December 31, 2009, only $38 million relating to tax credits
(primarily affordable housing credits) has been recognized for tax purposes, which impose a 20 year expiration
date by the operation of the United States tax law. The remaining gross deferred tax asset is produced by timing
differences between GAAP and taxable income, a significant portion of which relates to allowances for loan
losses. This portion of the gross deferred tax asset relates to items that have not yet reduced taxable income and
therefore, do not have a set expiration as of December 31, 2009.
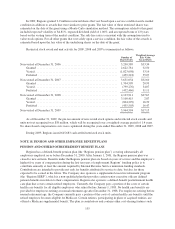
Accordingly, except as noted below relating to certain state tax net operating losses, management continues
to believe that it is more-likely-than-not that the federal and remaining state deferred tax assets are realizable.
At December 31, 2009, Regions has state and federal net operating loss carryforwards of $3.0 billion that
expire in years 2010 through 2029. Management does not believe that it can realize all of its state net operating
loss carryforwards. Accordingly, a valuation allowance of $23 million has been established against such benefits.
162