Regions Bank 2009 Annual Report Download - page 61
Download and view the complete annual report
Please find page 61 of the 2009 Regions Bank annual report below. You can navigate through the pages in the report by either clicking on the pages listed below, or by using the keyword search tool below to find specific information within the annual report.-
 1
1 -
2
-
3
-
4
-
5
-
6
-
7
-
8
-
9
-
10
-
11
-
12
-
13
-
14
-
15
-
16
-
17
-
18
-
19
-
20
-
21
-
22
-
23
-
24
-
25
-
26
-
27
-
28
-
29
-
30
-
31
-
32
-
33
-
34
-
35
-
36
-
37
-
38
-
39
-
40
-
41
-
42
-
43
-
44
-
45
-
46
-
47
-
48
-
49
-
50
-
 51
51 -
 52
52 -
 53
53 -
 54
54 -
 55
55 -
 56
56 -
 57
57 -
 58
58 -
 59
59 -
 60
60 -
 61
61 -
 62
62 -
 63
63 -
 64
64 -
 65
65 -
 66
66 -
 67
67 -
 68
68 -
 69
69 -
 70
70 -
 71
71 -
72
-
73
-
74
-
75
-
76
-
77
-
78
-
79
-
80
-
81
-
82
-
83
-
84
-
85
-
86
-
87
-
88
-
89
-
90
-
91
-
92
-
93
-
94
-
95
-
96
-
97
-
98
-
99
-
100
-
101
-
102
-
103
-
104
-
105
-
106
-
107
-
108
-
109
-
110
-
111
-
112
-
113
-
114
-
115
-
116
-
117
-
118
-
119
-
120
-
121
-
122
-
123
-
124
-
125
-
126
-
127
-
128
-
129
-
130
-
131
-
132
-
133
-
134
-
135
-
136
-
137
-
138
-
139
-
140
-
141
-
142
-
143
-
144
-
145
-
146
-
147
-
148
-
149
-
150
-
151
-
152
-
153
-
154
-
155
-
156
-
157
-
158
-
159
-
160
-
161
-
162
-
163
-
164
-
165
-
166
-
167
-
168
-
169
-
170
-
171
-
172
-
173
-
174
-
175
-
176
-
177
-
178
-
179
-
180
-
181
-
182
-
183
-
184
-
185
-
186
-
187
-
188
-
189
-
190
-
191
-
192
-
193
-
194
-
195
-
196
-
197
-
198
-
199
-
200
-
201
-
202
-
203
-
204
-
205
-
206
-
207
-
208
-
209
-
210
-
211
-
212
-
213
-
214
-
215
-
216
-
217
-
218
-
219
-
220
 |
 |

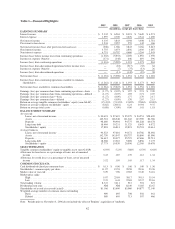
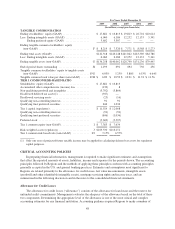
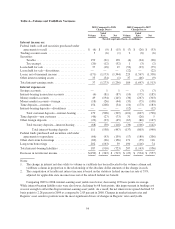
Table 2—GAAP to Non-GAAP Reconciliation
For Years Ended December 31
2009 2008 2007 2006 2005
(In millions, except per share data)
INCOME (LOSS)
Income (loss) from continuing operations (GAAP) ........ $(1,031) $ (5,585) $ 1,393 $ 1,373 $ 963
Preferred dividends (GAAP) ......................... (230) (26) — — —
Income (loss) from continuing operations available to
common shareholders (GAAP) ...................... (1,261) (5,611) 1,393 1,373 963
Income (loss) from discontinued operations, net of tax
(GAAP) ........................................ — (11) (142) (19) 38
Income (loss) available to common shareholders (GAAP) . . A $ (1,261) $ (5,622) $ 1,251 $ 1,354 $ 1,001
Income (loss) from continuing operations available to
common shareholders (GAAP) ...................... $(1,261) $ (5,611) $ 1,393 $ 1,373 $ 963
Merger-related charges, pre-tax
Salaries and employee benefits .................... — 134 159 66 74
Net occupancy expense .......................... — 4 34 3 5
Furniture and equipment expense .................. — 5 5 1 1
Other ........................................ — 58 153 19 89
Total merger-related charges, pre-tax ............... — 201 351 89 169
Merger-related charges, net of tax ..................... — 125 219 60 110
Goodwill impairment ............................... — 6,000 — — —
Income from continuing operations, excluding merger and
goodwill impairment charges (non-GAAP) ............ B $(1,261) $ 514 $ 1,612 $ 1,433 $ 1,073
Weighted-average diluted shares ...................... C 989 695 713 507 466
Earnings (loss) per common share—diluted (GAAP) ...... A/C $ (1.27) $ (8.09) $ 1.76 $ 2.67 $ 2.15
Earnings per common share from continuing operations,
excluding merger and goodwill impairment charges—
diluted (non-GAAP) .............................. B/C $ (1.27) $ 0.74 $ 2.26 $ 2.83 $ 2.30
RETURN ON AVERAGE TANGIBLE COMMON
STOCKHOLDERS’ EQUITY
Average stockholders’ equity (GAAP) .................. $17,773 $19,939 $20,036 $12,369 $10,678
Average intangible assets (GAAP) ..................... 6,122 11,949 12,130 6,450 5,357
Average preferred equity (GAAP) ..................... 3,487 425 — — —
Average tangible common stockholders’ equity (non-
GAAP) ........................................ D $ 8,164 $ 7,565 $ 7,906 $ 5,919 $ 5,321
Average stockholders’ equity, excluding discontinued
operations (GAAP) ............................... $17,773 $19,939 $20,013 $12,215 $10,539
Average intangible assets, excluding discontinued operations
(GAAP) ........................................ 6,122 11,949 12,130 6,450 5,357
Average preferred equity (GAAP) ..................... 3,487 425 — — —
Average tangible common equity, excluding discontinued
operations (non-GAAP) ........................... E $ 8,164 $ 7,565 $ 7,883 $ 5,765 $ 5,182
Return on average tangible common equity (non-GAAP) . . . A/D (15.45)% (74.32)% 15.82% 22.86% 18.80%
Return on average tangible common equity, excluding
discontinued operations, merger and goodwill impairment
charges (non-GAAP) ............................. B/E (15.45)% 6.79% 20.43% 24.92% 20.79%
47