Regions Bank 2009 Annual Report Download - page 84
Download and view the complete annual report
Please find page 84 of the 2009 Regions Bank annual report below. You can navigate through the pages in the report by either clicking on the pages listed below, or by using the keyword search tool below to find specific information within the annual report.-
 1
1 -
2
-
3
-
4
-
5
-
6
-
7
-
8
-
9
-
10
-
11
-
12
-
13
-
14
-
15
-
16
-
17
-
18
-
19
-
20
-
21
-
22
-
23
-
24
-
25
-
26
-
27
-
28
-
29
-
30
-
31
-
32
-
33
-
34
-
35
-
36
-
37
-
38
-
39
-
40
-
41
-
42
-
43
-
44
-
45
-
46
-
47
-
48
-
49
-
50
-
51
-
52
-
53
-
54
-
55
-
56
-
57
-
58
-
59
-
60
-
61
-
62
-
63
-
64
-
65
-
66
-
67
-
68
-
69
-
70
-
71
-
72
-
73
-
 74
74 -
 75
75 -
 76
76 -
 77
77 -
 78
78 -
 79
79 -
 80
80 -
 81
81 -
 82
82 -
 83
83 -
 84
84 -
 85
85 -
 86
86 -
 87
87 -
 88
88 -
 89
89 -
 90
90 -
 91
91 -
 92
92 -
 93
93 -
 94
94 -
95
-
96
-
97
-
98
-
99
-
100
-
101
-
102
-
103
-
104
-
105
-
106
-
107
-
108
-
109
-
110
-
111
-
112
-
113
-
114
-
115
-
116
-
117
-
118
-
119
-
120
-
121
-
122
-
123
-
124
-
125
-
126
-
127
-
128
-
129
-
130
-
131
-
132
-
133
-
134
-
135
-
136
-
137
-
138
-
139
-
140
-
141
-
142
-
143
-
144
-
145
-
146
-
147
-
148
-
149
-
150
-
151
-
152
-
153
-
154
-
155
-
156
-
157
-
158
-
159
-
160
-
161
-
162
-
163
-
164
-
165
-
166
-
167
-
168
-
169
-
170
-
171
-
172
-
173
-
174
-
175
-
176
-
177
-
178
-
179
-
180
-
181
-
182
-
183
-
184
-
185
-
186
-
187
-
188
-
189
-
190
-
191
-
192
-
193
-
194
-
195
-
196
-
197
-
198
-
199
-
200
-
201
-
202
-
203
-
204
-
205
-
206
-
207
-
208
-
209
-
210
-
211
-
212
-
213
-
214
-
215
-
216
-
217
-
218
-
219
-
220
 |
 |

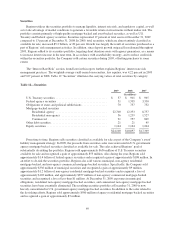
Net unrealized gains and losses in the securities available for sale portfolio are included in stockholders’ equity
as accumulated other comprehensive income or loss, net of tax. At December 31, 2009, securities available for sale
included a net unrealized gain of $431 million, which represented the difference between the estimated fair value of
these securities as of year-end and their amortized cost. The net unrealized gain represents $495 million in gross
unrealized gains and $64 million in gross unrealized losses. At December 31, 2008, securities available for sale
included a net unrealized loss of $12 million, which consisted of $552 million of gross unrealized gains and $564
million in gross unrealized losses. Equity securities consists predominantly of Federal Home Loan Bank stock and
Federal Reserve stock.
Regions evaluates securities in a loss position for other-than-temporary impairment, considering such factors
as the length of time and the extent to which the market value has been below cost, the credit standing of the issuer,
Regions’ intent to sell and whether it is more likely than not that the Company will have to sell the security before
its market value recovers. During 2009, Regions recognized, in earnings, approximately $75 million of securities
impairments, related primarily to non-agency residential mortgage-backed securities, equity securities, and a single
municipal issuer. During 2008, Regions recognized impairments of securities of approximately $28 million related
primarily to equity securities and retained interests on beneficial interests. Due to the de-risking measures referred to
above, the non-agency residential mortgage-backed securities for which other-than-temporary impairment was
recorded during 2009 were sold at a later date during 2009. The risk of prospective other-than-temporary
impairment charges is substantially lower at December 31, 2009 than in previous periods due to the shift in mix of
the portfolio. See Note 4 “Securities” to the consolidated financial statements for further details.
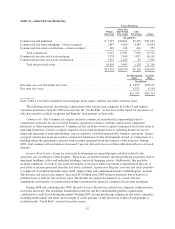
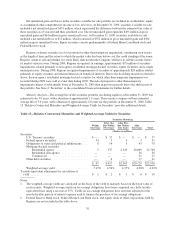
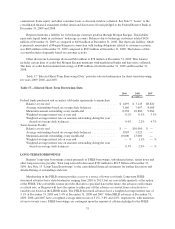
Maturity Analysis—The average life of the securities portfolio (excluding equities) at December 31, 2009 was
estimated to be 3.9 years, with a duration of approximately 1.9 years. These metrics compare with an estimated
average life of 3.0 years, with a duration of approximately 2.6 years for the portfolio at December 31, 2008. Table
13 “Relative Contractual Maturities and Weighted-Average Yields for Securities” provides additional details.
Table 13—Relative Contractual Maturities and Weighted-Average Yields for Securities
Securities Maturing
Within
One Year
After One
But Within
Five Years
After Five
But Within
Ten Years
After
Ten Years Total
(Dollars in millions)
Securities:
U.S. Treasury securities ...................... $— $ 57 $ — $ — $ 57
Federal agency securities ..................... 34 5 9 3 51
Obligations of states and political subdivisions .... 8 14 5 43 70
Mortgage-backed securities
Residential agency ...................... 5 337 2,349 20,009 22,700
Residential non-agency .................. — — — 36 36
Commercial ........................... — — — 21 21
Other debt securities ......................... — 4 — 17 21
$ 47 $ 417 $2,363 $20,129 $22,956
Weighted-average yield ...................... 5.19% 4.56% 4.37% 4.20% 4.22%
Taxable-equivalent adjustment for calculation of
yield ....................................... $ 1 $ 2 $ 1 $ 6 $ 10
Notes:
1. The weighted-average yields are calculated on the basis of the yield to maturity based on the book value of
each security. Weighted-average yields on tax-exempt obligations have been computed on a fully taxable-
equivalent basis using a tax rate of 35%. Yields on tax-exempt obligations have not been adjusted for the
non-deductible portion of interest expense used to finance the purchase of tax-exempt obligations.
2. Federal Reserve Bank stock, Federal Home Loan Bank stock, and equity stock of other corporations held by
Regions are not included in the table above.
70