Regions Bank 2009 Annual Report Download - page 115
Download and view the complete annual report
Please find page 115 of the 2009 Regions Bank annual report below. You can navigate through the pages in the report by either clicking on the pages listed below, or by using the keyword search tool below to find specific information within the annual report.-
 1
1 -
2
-
3
-
4
-
5
-
6
-
7
-
8
-
9
-
10
-
11
-
12
-
13
-
14
-
15
-
16
-
17
-
18
-
19
-
20
-
21
-
22
-
23
-
24
-
25
-
26
-
27
-
28
-
29
-
30
-
31
-
32
-
33
-
34
-
35
-
36
-
37
-
38
-
39
-
40
-
41
-
42
-
43
-
44
-
45
-
46
-
47
-
48
-
49
-
50
-
51
-
52
-
53
-
54
-
55
-
56
-
57
-
58
-
59
-
60
-
61
-
62
-
63
-
64
-
65
-
66
-
67
-
68
-
69
-
70
-
71
-
72
-
73
-
74
-
75
-
76
-
77
-
78
-
79
-
80
-
81
-
82
-
83
-
84
-
85
-
86
-
87
-
88
-
89
-
90
-
91
-
92
-
93
-
94
-
95
-
96
-
97
-
98
-
99
-
100
-
101
-
102
-
103
-
104
-
 105
105 -
 106
106 -
 107
107 -
 108
108 -
 109
109 -
 110
110 -
 111
111 -
 112
112 -
 113
113 -
 114
114 -
 115
115 -
 116
116 -
 117
117 -
 118
118 -
 119
119 -
 120
120 -
 121
121 -
 122
122 -
 123
123 -
 124
124 -
 125
125 -
126
-
127
-
128
-
129
-
130
-
131
-
132
-
133
-
134
-
135
-
136
-
137
-
138
-
139
-
140
-
141
-
142
-
143
-
144
-
145
-
146
-
147
-
148
-
149
-
150
-
151
-
152
-
153
-
154
-
155
-
156
-
157
-
158
-
159
-
160
-
161
-
162
-
163
-
164
-
165
-
166
-
167
-
168
-
169
-
170
-
171
-
172
-
173
-
174
-
175
-
176
-
177
-
178
-
179
-
180
-
181
-
182
-
183
-
184
-
185
-
186
-
187
-
188
-
189
-
190
-
191
-
192
-
193
-
194
-
195
-
196
-
197
-
198
-
199
-
200
-
201
-
202
-
203
-
204
-
205
-
206
-
207
-
208
-
209
-
210
-
211
-
212
-
213
-
214
-
215
-
216
-
217
-
218
-
219
-
220
 |
 |

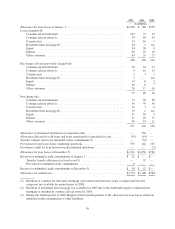
available, the observable market price. For consumer TDRs, Regions measures the level of impairment based on
pools of loans stratified by common risk characteristics. If current valuations are lower than the current book
balance of the credit, the negative differences are reviewed for possible charge-off. In instances where
management determines that a charge-off is not appropriate, a specific reserve is established for the individual
loan in question. That specific reserve is incorporated as a part of the overall allowance for credit losses. The
recorded investment in impaired loans was $5.0 billion at December 31, 2009 and $1.4 billion at December 31,
2008. The allowance allocated to impaired loans, excluding TDRs, totaled $403 million and $130 million at
December 31, 2009 and 2008, respectively. Loans that were characterized as TDRs totaled $1.9 billion and $533
million at December 31, 2009 and 2008, respectively, and the allowance allocated to TDRs at December 31,
2009 and 2008 totaled $38 million and $9 million, respectively. The allocation to TDRs is a result of the type of
loans considered TDRs as well as the current payment status of the borrowers. Restructured residential and home
equity loans comprise 91 percent of all TDRs and 95 percent of all accruing TDRs at December 31, 2009. As
shown in the table below, the majority of consumer TDRs are on accrual status at December 31, 2009, which is
considered an indication of relatively low loss content. The average amount of impaired loans was $3.6 billion
during 2009 and $1.3 billion during 2008. No material amount of interest income was recognized on impaired
loans for the years ended December 31, 2009, 2008 and 2007.
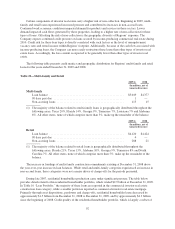
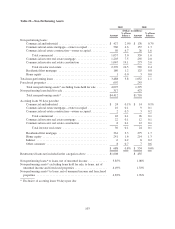
The following table summarizes TDRs for the years ended December 31, 2009 and 2008:
Table 28—Troubled Debt Restructurings
2009 2008
(In millions)
Accruing:
Commercial and industrial .......................................... $ 25 $ 1
Residential first mortgage .......................................... 1,291 406
Home equity ..................................................... 241 48
Other consumer .................................................. 51 —
1,608 455
Non-accrual status or 90 days past due:
Commercial and industrial .......................................... 92 10
Residential first mortgage .......................................... 178 67
Home equity ..................................................... 17 1
287 78
$1,895 $533
The increase in TDRs in 2009 is primarily related to restructuring of residential first mortgage and home
equity loans. Regions continues to work to meet individual needs of consumer borrowers to stem foreclosures
through the Customer Assistance Program. As a result, Regions initiated a significant number of extensions and
modifications beginning in late 2008 and continuing throughout 2009.
NON-PERFORMING ASSETS
Non-performing assets consist of loans on non-accrual status and foreclosed properties. Loans are placed on
non-accrual status when management has determined that payment of all contractual principal and interest is in
doubt, or the loan is past due 90 days or more as to principal and interest unless well-secured and in the process
of collection. When a commercial loan is placed on non-accrual status, uncollected interest accrued in the current
year is reversed and charged to interest income. Uncollected interest accrued from prior years on commercial
loans placed on non-accrual status in the current year is charged against the allowance for loan losses. When a
consumer loan is placed on non-accrual status, all uncollected interest accrued is reversed and charged to interest
income.
101