Regions Bank 2009 Annual Report Download - page 198
Download and view the complete annual report
Please find page 198 of the 2009 Regions Bank annual report below. You can navigate through the pages in the report by either clicking on the pages listed below, or by using the keyword search tool below to find specific information within the annual report.-
 1
1 -
2
-
3
-
4
-
5
-
6
-
7
-
8
-
9
-
10
-
11
-
12
-
13
-
14
-
15
-
16
-
17
-
18
-
19
-
20
-
21
-
22
-
23
-
24
-
25
-
26
-
27
-
28
-
29
-
30
-
31
-
32
-
33
-
34
-
35
-
36
-
37
-
38
-
39
-
40
-
41
-
42
-
43
-
44
-
45
-
46
-
47
-
48
-
49
-
50
-
51
-
52
-
53
-
54
-
55
-
56
-
57
-
58
-
59
-
60
-
61
-
62
-
63
-
64
-
65
-
66
-
67
-
68
-
69
-
70
-
71
-
72
-
73
-
74
-
75
-
76
-
77
-
78
-
79
-
80
-
81
-
82
-
83
-
84
-
85
-
86
-
87
-
88
-
89
-
90
-
91
-
92
-
93
-
94
-
95
-
96
-
97
-
98
-
99
-
100
-
101
-
102
-
103
-
104
-
105
-
106
-
107
-
108
-
109
-
110
-
111
-
112
-
113
-
114
-
115
-
116
-
117
-
118
-
119
-
120
-
121
-
122
-
123
-
124
-
125
-
126
-
127
-
128
-
129
-
130
-
131
-
132
-
133
-
134
-
135
-
136
-
137
-
138
-
139
-
140
-
141
-
142
-
143
-
144
-
145
-
146
-
147
-
148
-
149
-
150
-
151
-
152
-
153
-
154
-
155
-
156
-
157
-
158
-
159
-
160
-
161
-
162
-
163
-
164
-
165
-
166
-
167
-
168
-
169
-
170
-
171
-
172
-
173
-
174
-
175
-
176
-
177
-
178
-
179
-
180
-
181
-
182
-
183
-
184
-
185
-
186
-
187
-
 188
188 -
 189
189 -
 190
190 -
 191
191 -
 192
192 -
 193
193 -
 194
194 -
 195
195 -
 196
196 -
 197
197 -
 198
198 -
 199
199 -
 200
200 -
 201
201 -
 202
202 -
 203
203 -
 204
204 -
 205
205 -
 206
206 -
 207
207 -
 208
208 -
209
-
210
-
211
-
212
-
213
-
214
-
215
-
216
-
217
-
218
-
219
-
220
 |
 |

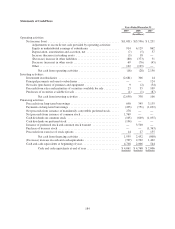
Statements of Cash Flows
Years Ended December 31
2009 2008 2007
(In millions)
Operating activities:
Net income (loss) ................................................ $(1,031) $(5,596) $ 1,251
Adjustments to reconcile net cash provided by operating activities:
Equity in undistributed earnings of subsidiaries .................... 914 6,129 862
Depreciation, amortization and accretion, net ...................... (7) (5) 57
Increase (decrease) in trading assets ............................. (3) 18 —
(Decrease) increase in other liabilities ............................ (80) (373) 31
Decrease (increase) in other assets ............................... 69 (76) (45)
Other ...................................................... 122 (125) —
Net cash from operating activities ........................... (16) (28) 2,156
Investing activities:
Investment in subsidiaries ......................................... (2,681) 306 14
Principal payments on loans to subsidiaries ............................ — — 124
Net sales (purchases) of premises and equipment ....................... 9 (2) (54)
Proceeds from sales and maturities of securities available for sale .......... 23 35 109
Purchases of securities available for sale .............................. (1) (1) (87)
Net cash from investing activities ........................... (2,650) 338 106
Financing activities:
Proceeds from long-term borrowings ................................. 690 345 3,135
Payments on long-term borrowings .................................. (493) (751) (1,692)
Net proceeds from issuance of mandatorily convertible preferred stock ...... 278 — —
Net proceeds from issuance of common stock .......................... 1,769 — —
Cash dividends on common stock ................................... (105) (669) (1,035)
Cash dividends on preferred stock ................................... (194) — —
Issuance of preferred stock and common stock warrant .................. — 3,500 —
Purchase of treasury stock ......................................... — — (1,363)
Proceeds from exercise of stock options .............................. 14 27 155
Net cash from financing activities ........................... 1,959 2,452 (800)
(Decrease) increase in cash and cash equivalents ....................... (707) 2,762 1,462
Cash and cash equivalents at beginning of year ......................... 4,768 2,006 544
Cash and cash equivalents at end of year ...................... $4,061 $ 4,768 $ 2,006
184