Regions Bank 2009 Annual Report Download - page 188
Download and view the complete annual report
Please find page 188 of the 2009 Regions Bank annual report below. You can navigate through the pages in the report by either clicking on the pages listed below, or by using the keyword search tool below to find specific information within the annual report.-
 1
1 -
2
-
3
-
4
-
5
-
6
-
7
-
8
-
9
-
10
-
11
-
12
-
13
-
14
-
15
-
16
-
17
-
18
-
19
-
20
-
21
-
22
-
23
-
24
-
25
-
26
-
27
-
28
-
29
-
30
-
31
-
32
-
33
-
34
-
35
-
36
-
37
-
38
-
39
-
40
-
41
-
42
-
43
-
44
-
45
-
46
-
47
-
48
-
49
-
50
-
51
-
52
-
53
-
54
-
55
-
56
-
57
-
58
-
59
-
60
-
61
-
62
-
63
-
64
-
65
-
66
-
67
-
68
-
69
-
70
-
71
-
72
-
73
-
74
-
75
-
76
-
77
-
78
-
79
-
80
-
81
-
82
-
83
-
84
-
85
-
86
-
87
-
88
-
89
-
90
-
91
-
92
-
93
-
94
-
95
-
96
-
97
-
98
-
99
-
100
-
101
-
102
-
103
-
104
-
105
-
106
-
107
-
108
-
109
-
110
-
111
-
112
-
113
-
114
-
115
-
116
-
117
-
118
-
119
-
120
-
121
-
122
-
123
-
124
-
125
-
126
-
127
-
128
-
129
-
130
-
131
-
132
-
133
-
134
-
135
-
136
-
137
-
138
-
139
-
140
-
141
-
142
-
143
-
144
-
145
-
146
-
147
-
148
-
149
-
150
-
151
-
152
-
153
-
154
-
155
-
156
-
157
-
158
-
159
-
160
-
161
-
162
-
163
-
164
-
165
-
166
-
167
-
168
-
169
-
170
-
171
-
172
-
173
-
174
-
175
-
176
-
177
-
 178
178 -
 179
179 -
 180
180 -
 181
181 -
 182
182 -
 183
183 -
 184
184 -
 185
185 -
 186
186 -
 187
187 -
 188
188 -
 189
189 -
 190
190 -
 191
191 -
 192
192 -
 193
193 -
 194
194 -
 195
195 -
 196
196 -
 197
197 -
 198
198 -
199
-
200
-
201
-
202
-
203
-
204
-
205
-
206
-
207
-
208
-
209
-
210
-
211
-
212
-
213
-
214
-
215
-
216
-
217
-
218
-
219
-
220
 |
 |

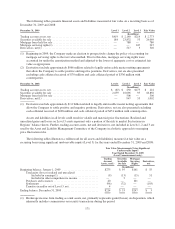
In addition to the assets currently measured at fair value mentioned above, Regions often uses fair value
measurements in determining the period-end balance of certain financial instruments such as non-marketable
investments. Typically, these assets use fair value measurements to determine the recorded lower of cost or fair
value of the asset or to determine the losses incurred during the period.
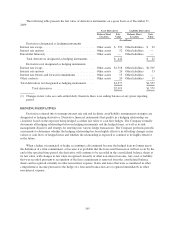
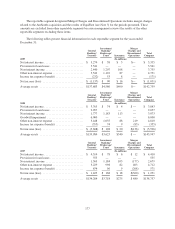
The following tables present the carrying value of those assets measured at fair value on a non-recurring
basis as of December 31, 2009 and 2008, as well as the corresponding fair value adjustments. The table does not
reflect the change in fair value attributable to any related economic hedges the Company used to mitigate the
interest rate risk associated with these assets.
Carrying Value as of
December 31, 2009
Fair value
adjustments for
the year ended
December 31, 2009Level 1 Level 2 Level 3 Total
(In millions)
Loans held for sale .................................. $— $ 86 $ 17 $103 $(54)
Foreclosed property and other real estate(1) .............. — 362 — 362 (59)
(1) Beginning in 2009, due to issuance of new accounting guidance, non-financial assets and liabilities were
required to be reported with non-recurring fair value measurements.
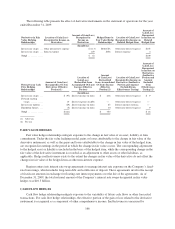
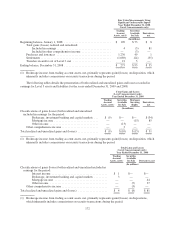
Carrying Value as of
December 31, 2008
Fair value
adjustments for
the year ended
December 31, 2008Level 1 Level 2 Level 3 Total
(In millions)
Loans held for sale .................................. $— $134 $221 $355 $(359)
Mortgage servicing rights(1) .......................... — — 161 161 (85)
(1) Beginning in 2009, the Company made an election to prospectively change the policy for accounting for
mortgage servicing rights to fair value. Prior to this date, mortgage servicing rights were accounted for
under the amortization method and adjusted to the lower of aggregate cost or estimated fair value as
appropriate. Accordingly, prior to the change, lower of cost or fair value adjustments to mortgage servicing
rights were considered non-recurring fair value adjustments.
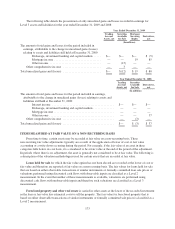
FAIR VALUE OPTION
Regions adopted the fair value option for certain financial assets and financial liabilities as of January 1,
2008. The fair value option allows an entity the irrevocable option to elect fair value for the initial and
subsequent measurement for certain financial assets and liabilities on a contract-by-contract basis. Additionally,
the fair value option requires the difference between the carrying value before election of the fair value option
and the fair value of these financial instruments be recorded as an adjustment to beginning retained earnings in
the period of adoption. There was no material effect of adoption on the consolidated financial statements.
Regions elected the fair value option for residential mortgage loans held for sale originated after January 1,
2008. This election allows for a more effective offset of the changes in fair values of the loans and the derivative
instruments used to economically hedge them without the burden of complying with the requirements for hedge
accounting. Regions has not elected the fair value option for other loans held for sale primarily because they are
not economically hedged using derivative instruments. Fair values of loans held for sale are based on traded
market prices of similar assets where available and/or discounted cash flows at market interest rates, adjusted for
securitization activities that include servicing values and market conditions. At December 31, 2009 and 2008,
loans held for sale for which the fair value option was elected had an aggregate fair value of $780 million and
$506 million, respectively, and an aggregate outstanding principal balance of $773 million and $492 million,
respectively, and were recorded in loans held for sale in the consolidated balance sheet. Interest income on
mortgage loans held for sale is recognized based on contractual rates and reflected in interest income on loans
174