Regions Bank 2009 Annual Report Download - page 88
Download and view the complete annual report
Please find page 88 of the 2009 Regions Bank annual report below. You can navigate through the pages in the report by either clicking on the pages listed below, or by using the keyword search tool below to find specific information within the annual report.-
 1
1 -
2
-
3
-
4
-
5
-
6
-
7
-
8
-
9
-
10
-
11
-
12
-
13
-
14
-
15
-
16
-
17
-
18
-
19
-
20
-
21
-
22
-
23
-
24
-
25
-
26
-
27
-
28
-
29
-
30
-
31
-
32
-
33
-
34
-
35
-
36
-
37
-
38
-
39
-
40
-
41
-
42
-
43
-
44
-
45
-
46
-
47
-
48
-
49
-
50
-
51
-
52
-
53
-
54
-
55
-
56
-
57
-
58
-
59
-
60
-
61
-
62
-
63
-
64
-
65
-
66
-
67
-
68
-
69
-
70
-
71
-
72
-
73
-
74
-
75
-
76
-
77
-
 78
78 -
 79
79 -
 80
80 -
 81
81 -
 82
82 -
 83
83 -
 84
84 -
 85
85 -
 86
86 -
 87
87 -
 88
88 -
 89
89 -
 90
90 -
 91
91 -
 92
92 -
 93
93 -
 94
94 -
 95
95 -
 96
96 -
 97
97 -
 98
98 -
99
-
100
-
101
-
102
-
103
-
104
-
105
-
106
-
107
-
108
-
109
-
110
-
111
-
112
-
113
-
114
-
115
-
116
-
117
-
118
-
119
-
120
-
121
-
122
-
123
-
124
-
125
-
126
-
127
-
128
-
129
-
130
-
131
-
132
-
133
-
134
-
135
-
136
-
137
-
138
-
139
-
140
-
141
-
142
-
143
-
144
-
145
-
146
-
147
-
148
-
149
-
150
-
151
-
152
-
153
-
154
-
155
-
156
-
157
-
158
-
159
-
160
-
161
-
162
-
163
-
164
-
165
-
166
-
167
-
168
-
169
-
170
-
171
-
172
-
173
-
174
-
175
-
176
-
177
-
178
-
179
-
180
-
181
-
182
-
183
-
184
-
185
-
186
-
187
-
188
-
189
-
190
-
191
-
192
-
193
-
194
-
195
-
196
-
197
-
198
-
199
-
200
-
201
-
202
-
203
-
204
-
205
-
206
-
207
-
208
-
209
-
210
-
211
-
212
-
213
-
214
-
215
-
216
-
217
-
218
-
219
-
220
 |
 |

Consistent with prior year, total treasury deposits, which are used mainly for overnight funding purposes
remained low, as the Company continued to utilize customer-based funding sources and the additional funding
provided through new governmental liquidity programs. The Company’s choice of overnight funding sources is
dependent on the Company’s particular funding needs and the relative attractiveness of each offering.
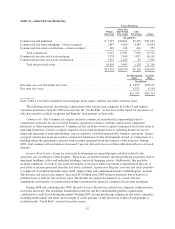
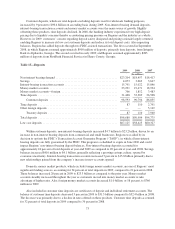
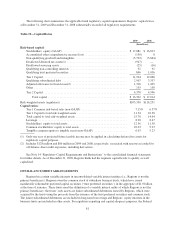
The sensitivity of Regions’ deposit rates to changes in market interest rates is reflected in Regions’ average
interest rate paid on interest-bearing deposits. The rate paid on interest-bearing deposits decreased to 1.73 percent
in 2009 from 2.38 percent in 2008. This decrease is largely due to the significant decrease in market rates as
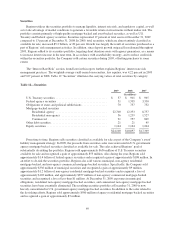
evidenced by the Federal Funds rate in 2009, somewhat offset by increased competitive pressures. Table 16
“Maturity of Time Deposits of $100,000 or More” presents maturities of time deposits of $100,000 or more at
December 31, 2009 and 2008.
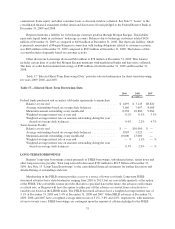
Table 16—Maturity of Time Deposits of $100,000 or More
2009 2008
(In millions)
Time deposits of $100,000 or more, maturing in:
3 months or less ......................................................... $ 3,521 $ 2,806
Over 3 through 6 months .................................................. 1,332 1,977
Over 6 through 12 months ................................................. 2,442 3,038
Over 12 months ......................................................... 5,349 4,893
$12,644 $12,714
SHORT-TERM BORROWINGS
Regions’ short-term borrowings consist primarily of federal funds purchased, securities sold under
agreements to repurchase and Federal Home Loan Bank (“FHLB”) advances. See Note 12 “Short-Term
Borrowings” to the consolidated financial statements for further detail and discussion.
Federal funds purchased from downstream sources and securities sold under agreements to repurchase
totaled $1.9 billion at December 31, 2009, compared to $3.1 billion at year-end 2008. Regions had no balances in
federal funds purchased from up-stream correspondents at December 31, 2009. The level of federal funds
purchased and securities sold under agreements to repurchase can fluctuate significantly on a day-to-day basis,
depending on funding requirements and which sources of funds are used to satisfy those needs. The balance of
federal funds purchased and security repurchase agreements, net of federal funds sold and security reverse
repurchase agreements, decreased $1.2 billion in 2009 due to the increased funding provided by deposits as
discussed above. As another source of funding, the Company utilized short-term borrowings through the issuance
of FHLB advances. FHLB borrowings are used to satisfy short-term funding requirements and can also fluctuate
between periods. Short-term FHLB borrowings totaled $1.0 billion at December 31, 2009 compared to $1.5
billion at December 31, 2008. The Company continues to utilize FHLB borrowings as a means to reduce
overnight funding and diversify into slightly longer-term maturities at preferable rates.
During 2008, Regions was an active participant in the Federal Reserve’s TAF program, which was designed
to address pressures in short-term funding markets. Regions continued to participate in TAF in the first half of
2009 and completely exited the program in July of 2009. At December 31, 2009, Regions did not have any
borrowings under the TAF and currently does not plan to borrow again through the TAF program.
As of December 31, 2009, Regions had $7 million outstanding in the Federal Reserve’s Treasury, Tax, and
Loan Program, compared to $125 thousand at December 31, 2008. At December 31, 2009, Regions can borrow a
maximum amount of approximately $14 billion from the Federal Reserve Bank. Regions has pledged certain
74