RBS 2003 Annual Report Download - page 100
Download and view the complete annual report
Please find page 100 of the 2003 RBS annual report below. You can navigate through the pages in the report by either clicking on the pages listed below, or by using the keyword search tool below to find specific information within the annual report.-
 1
1 -
2
-
3
-
4
-
5
-
6
-
7
-
8
-
9
-
10
-
11
-
12
-
13
-
14
-
15
-
16
-
17
-
18
-
19
-
20
-
21
-
22
-
23
-
24
-
25
-
26
-
27
-
28
-
29
-
30
-
31
-
32
-
33
-
34
-
35
-
36
-
37
-
38
-
39
-
40
-
41
-
42
-
43
-
44
-
45
-
46
-
47
-
48
-
49
-
50
-
51
-
52
-
53
-
54
-
55
-
56
-
57
-
58
-
59
-
60
-
61
-
62
-
63
-
64
-
65
-
66
-
67
-
68
-
69
-
70
-
71
-
72
-
73
-
74
-
75
-
76
-
77
-
78
-
79
-
80
-
81
-
82
-
83
-
84
-
85
-
86
-
87
-
88
-
89
-
 90
90 -
 91
91 -
 92
92 -
 93
93 -
 94
94 -
 95
95 -
 96
96 -
 97
97 -
 98
98 -
 99
99 -
 100
100 -
 101
101 -
 102
102 -
 103
103 -
 104
104 -
 105
105 -
 106
106 -
 107
107 -
 108
108 -
 109
109 -
 110
110 -
111
-
112
-
113
-
114
-
115
-
116
-
117
-
118
-
119
-
120
-
121
-
122
-
123
-
124
-
125
-
126
-
127
-
128
-
129
-
130
-
131
-
132
-
133
-
134
-
135
-
136
-
137
-
138
-
139
-
140
-
141
-
142
-
143
-
144
-
145
-
146
-
147
-
148
-
149
-
150
-
151
-
152
-
153
-
154
-
155
-
156
-
157
-
158
-
159
-
160
-
161
-
162
-
163
-
164
-
165
-
166
-
167
-
168
-
169
-
170
-
171
-
172
-
173
-
174
-
175
-
176
-
177
-
178
-
179
-
180
-
181
-
182
-
183
-
184
-
185
-
186
-
187
-
188
-
189
-
190
-
191
-
192
-
193
-
194
-
195
-
196
-
197
-
198
-
199
-
200
-
201
-
202
-
203
-
204
-
205
-
206
-
207
-
208
-
209
-
210
-
211
-
212
-
213
-
214
-
215
-
216
-
217
-
218
-
219
-
220
-
221
-
222
-
223
-
224
-
225
-
226
-
227
-
228
-
229
-
230
 |
 |

Operating and financial review continued
98
Operating and financial review
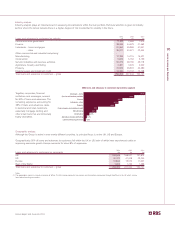
Credit risk (continued)
Provisions
The Group provides for losses in its loan portfolio so as to
record impaired loans and advances at their expected ultimate
net realisable value. The objective is to set provisions based on
the current understanding of the portfolio. To reach this
understanding, retail and corporate loans and advances are
treated separately.
The Group’s retail portfolios which consist of small value, high
volume credits have highly efficient largely automated processes
for identifying problem credits and very short timescales,
typically three months, before resolution or adoption of various
recovery measures.
Corporate portfolios consist of higher value, lower volume
credits, which tend to be structured to meet individual
customers requirements. These portfolios do not have an
automated provisioning process, relying on individual expert
judgement, controls and oversight to identify problems.
Early and proactive management of problem exposures ensures
that credit losses are minimised. Specialised units are used for
different customer types to ensure that the appropriate risk
mitigation is taken in a timely manner.
Specific and general provisions
Provisions fall into one of two categories, specific or general:
•Specific provisions: arise when the creditworthiness of a
borrower has undergone a significant deterioration and the
recovery of the advance is in significant doubt. The amount
of specific provision will reflect the financial condition of the
borrower, the realisable value of security and the costs of
recovery.
•General provisions: cover losses that have not yet been
specifically identified but are known from experience to be
present in any portfolio of loans. The level of general
provision reflects the size and diversity of the Group’s loan
portfolio, past experience, the current state of the
economies in which the Group operates and the scope of
specific provisioning procedures.
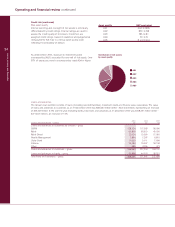
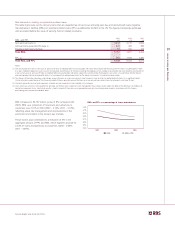
Provisions for bad and doubtful debts at the end of 2003 were
broadly unchanged from the previous year end. The increase
in provisions of £1,461 million through the charge to the profit
and loss account was substantially offset by the amounts
written-off, net of recoveries, of £1,447 million. This, coupled
with the growth in the portfolio, led to a reduction in the ratio of
provisions to loans and advances to customers from 1.72% at
the end of 2002 to 1.53%.
The coverage ratio of closing provisions as a percentage of
REIL has reduced to 76% from 81% at the end of 2002. This is
due to a slight shift in the composition of REIL away from
larger corporate customers, against which the Group typically
holds less security and thus requires higher provisions
proportionately, and into smaller mid-corporate customers
against which the Group tends to hold higher levels of security.
The coverage ratio of total closing provisions as a percentage of
PPL and REIL has increased to 68% from 65% and 66% at the
end of 2002 and 2001 respectively.
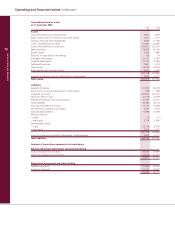
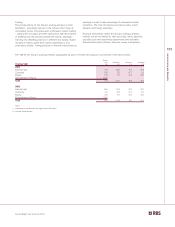
2003 2002 2001
Summary of provisions £m £m £m
Specific provision13,356 3,323 3,031
General provision 566 597 614
Total bad and doubtful debt provisions 3,922 3,920 3,645
Total loans and advances to customers 256,453 227,244 194,137
Specific provision as a percentage of loans and advances to customers 1.31% 1.46% 1.56%
General provision as a percentage of loans and advances to customers 0.22% 0.26% 0.32%
Total provisions as a percentage of loans and advances to customers 1.53% 1.72% 1.88%
Closing provisions for bad and doubtful debts expressed as a:
% of REIL 76% 81% 81%
% of REIL and PPL 68% 65% 66%
(1) Excludes specific provisions against loans and advances to banks of £7 million (2002 – £7 million; 2001 – £8 million)