RBS 2003 Annual Report Download - page 98
Download and view the complete annual report
Please find page 98 of the 2003 RBS annual report below. You can navigate through the pages in the report by either clicking on the pages listed below, or by using the keyword search tool below to find specific information within the annual report.-
 1
1 -
2
-
3
-
4
-
5
-
6
-
7
-
8
-
9
-
10
-
11
-
12
-
13
-
14
-
15
-
16
-
17
-
18
-
19
-
20
-
21
-
22
-
23
-
24
-
25
-
26
-
27
-
28
-
29
-
30
-
31
-
32
-
33
-
34
-
35
-
36
-
37
-
38
-
39
-
40
-
41
-
42
-
43
-
44
-
45
-
46
-
47
-
48
-
49
-
50
-
51
-
52
-
53
-
54
-
55
-
56
-
57
-
58
-
59
-
60
-
61
-
62
-
63
-
64
-
65
-
66
-
67
-
68
-
69
-
70
-
71
-
72
-
73
-
74
-
75
-
76
-
77
-
78
-
79
-
80
-
81
-
82
-
83
-
84
-
85
-
86
-
87
-
 88
88 -
 89
89 -
 90
90 -
 91
91 -
 92
92 -
 93
93 -
 94
94 -
 95
95 -
 96
96 -
 97
97 -
 98
98 -
 99
99 -
 100
100 -
 101
101 -
 102
102 -
 103
103 -
 104
104 -
 105
105 -
 106
106 -
 107
107 -
 108
108 -
109
-
110
-
111
-
112
-
113
-
114
-
115
-
116
-
117
-
118
-
119
-
120
-
121
-
122
-
123
-
124
-
125
-
126
-
127
-
128
-
129
-
130
-
131
-
132
-
133
-
134
-
135
-
136
-
137
-
138
-
139
-
140
-
141
-
142
-
143
-
144
-
145
-
146
-
147
-
148
-
149
-
150
-
151
-
152
-
153
-
154
-
155
-
156
-
157
-
158
-
159
-
160
-
161
-
162
-
163
-
164
-
165
-
166
-
167
-
168
-
169
-
170
-
171
-
172
-
173
-
174
-
175
-
176
-
177
-
178
-
179
-
180
-
181
-
182
-
183
-
184
-
185
-
186
-
187
-
188
-
189
-
190
-
191
-
192
-
193
-
194
-
195
-
196
-
197
-
198
-
199
-
200
-
201
-
202
-
203
-
204
-
205
-
206
-
207
-
208
-
209
-
210
-
211
-
212
-
213
-
214
-
215
-
216
-
217
-
218
-
219
-
220
-
221
-
222
-
223
-
224
-
225
-
226
-
227
-
228
-
229
-
230
 |
 |

Operating and financial review continued
96
Operating and financial review
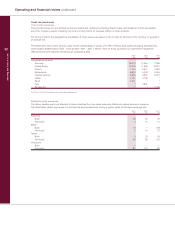
Credit risk (continued)
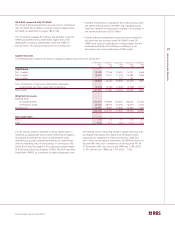
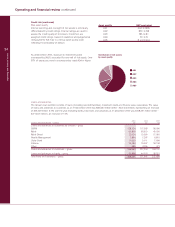
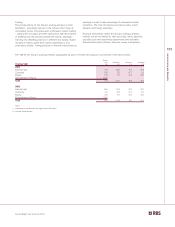
Cross border exposures
Cross border exposures are defined as loans to banks and customers (including finance lease and instalment credit receivables)
and other monetary assets, including non-local currency claims of overseas offices on local residents.
The Group monitors the geographical breakdown of these exposures based on the country of domicile of the borrower or guarantor
of ultimate risk.
The table below sets out the Group’s cross border outstandings in excess of 0.75% of Group total assets (including acceptances),
which totalled £455.9 billion (2002 – £414.4 billion; 2001 – £371.7 billion). None of these countries has experienced repayment
difficulties that have required refinancing of outstanding debt.
2003 2002 2001
£m £m £m
Geographical analysis:
Germany 15,073 10,464 7,969
United States 14,618 11,658 8,901
France 7,524 5,971 4,930
Netherlands 6,830 6,318 4,596
Cayman Islands 6,666 6,897 5,501
Japan 4,141 3,156 *
Spain 3,421 **
Italy * 3,867 *
Switzerland ** 3,646
* Less than 0.75% of Group total assets (including acceptances).
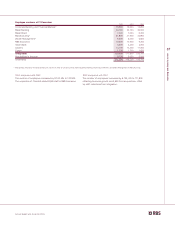
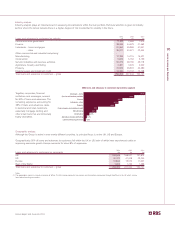
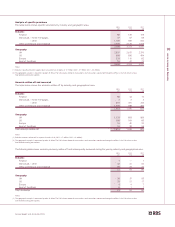
Selected country exposures
The Group devotes particular attention to those countries that have been adversely affected by global economic pressure.
The table below details exposures to countries that are considered as having a higher credit and foreign exchange risk.
2003 2002 2001
£m £m £m
Argentina
Bank 26 30 39
Non-bank 4 15 12
Brazil
Bank 15 — 158
Non-bank 2 14 22
Tu r ke y
Bank 5 25 38
Non-bank 65 65 102
Venezuela
Bank — ——
Non-bank 87 115 99