RBS 2003 Annual Report Download - page 103
Download and view the complete annual report
Please find page 103 of the 2003 RBS annual report below. You can navigate through the pages in the report by either clicking on the pages listed below, or by using the keyword search tool below to find specific information within the annual report.-
 1
1 -
2
-
3
-
4
-
5
-
6
-
7
-
8
-
9
-
10
-
11
-
12
-
13
-
14
-
15
-
16
-
17
-
18
-
19
-
20
-
21
-
22
-
23
-
24
-
25
-
26
-
27
-
28
-
29
-
30
-
31
-
32
-
33
-
34
-
35
-
36
-
37
-
38
-
39
-
40
-
41
-
42
-
43
-
44
-
45
-
46
-
47
-
48
-
49
-
50
-
51
-
52
-
53
-
54
-
55
-
56
-
57
-
58
-
59
-
60
-
61
-
62
-
63
-
64
-
65
-
66
-
67
-
68
-
69
-
70
-
71
-
72
-
73
-
74
-
75
-
76
-
77
-
78
-
79
-
80
-
81
-
82
-
83
-
84
-
85
-
86
-
87
-
88
-
89
-
90
-
91
-
92
-
 93
93 -
 94
94 -
 95
95 -
 96
96 -
 97
97 -
 98
98 -
 99
99 -
 100
100 -
 101
101 -
 102
102 -
 103
103 -
 104
104 -
 105
105 -
 106
106 -
 107
107 -
 108
108 -
 109
109 -
 110
110 -
 111
111 -
 112
112 -
 113
113 -
114
-
115
-
116
-
117
-
118
-
119
-
120
-
121
-
122
-
123
-
124
-
125
-
126
-
127
-
128
-
129
-
130
-
131
-
132
-
133
-
134
-
135
-
136
-
137
-
138
-
139
-
140
-
141
-
142
-
143
-
144
-
145
-
146
-
147
-
148
-
149
-
150
-
151
-
152
-
153
-
154
-
155
-
156
-
157
-
158
-
159
-
160
-
161
-
162
-
163
-
164
-
165
-
166
-
167
-
168
-
169
-
170
-
171
-
172
-
173
-
174
-
175
-
176
-
177
-
178
-
179
-
180
-
181
-
182
-
183
-
184
-
185
-
186
-
187
-
188
-
189
-
190
-
191
-
192
-
193
-
194
-
195
-
196
-
197
-
198
-
199
-
200
-
201
-
202
-
203
-
204
-
205
-
206
-
207
-
208
-
209
-
210
-
211
-
212
-
213
-
214
-
215
-
216
-
217
-
218
-
219
-
220
-
221
-
222
-
223
-
224
-
225
-
226
-
227
-
228
-
229
-
230
 |
 |

101
Annual Report and Accounts 2003
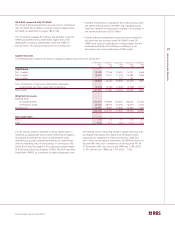
Operating and financial review
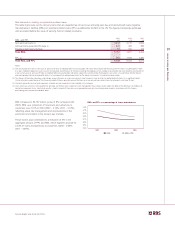
Customer accounts, excluding repo agreements, grew by
£15,841 million (8%), and represent 58% of the Group’s
funding excluding capital and other liabilities. In reflection of
the higher rate of growth in customer loans and advances
excluding reverse repos, up £27,081 million (13%), the
proportion of funding from wholesale sources has increased.
Repo agreements with corporate and institutional customers
are undertaken primarily by RBS Greenwich Capital in the US
and by Financial Markets. Repo activity with customers
represented 7% of the Group’s funding excluding capital and
other liabilities at 31 December 2003.
Deposits by banks increased by £12,603 million to represent
19% of the Group’s funding, excluding capital and other
liabilities. Deposits by banks are taken from a wide range of
counterparties, with the largest single depositor continuing to
represent less than 1% of the Group’s total funding.
Debt securities in issue increased by £7,078 million to represent
11% of the Group’s funding, excluding capital and other
liabilities, at 31 December 2003. Total debt securities in issue
at 31 December 2003 includes £9,187 million (2002 – £6,035
million) with a maturity of over one year, reflecting the activity of
the Group in raising term funds through its Euro Medium Term
Note programme and other term issues.
The Group remains well placed to access various wholesale
funding sources from a wide range of counterparties and
markets, and the changing mix evident between customer
repos, deposits by banks and debt securities in issue primarily
reflects comparative pricing and investor/counterparty demand
rather than a material perceived trend.
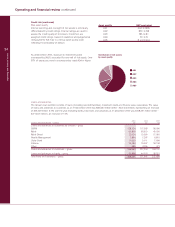
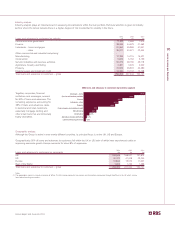
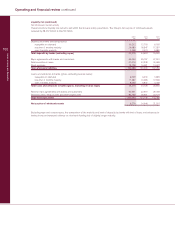
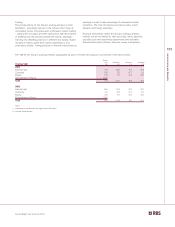
Sources of funding
Excluding capital and other liabilities, customer accounts continue to provide a substantial majority of the Group’s funding and
represent a well diversified and stable source of funds from a wide range of retail, corporate and non-bank institutional customers.
2003 2002 2001
£m % £m % £m %
Customer accounts (excluding repos):
Repayable on demand 141,560 39 127,320 39 115,054 41
Time deposits 68,382 19 66,781 21 66,486 23
Total customer accounts (excluding repos) 209,942 58 194,101 60 181,540 64
Repo agreements with customers 27,021 7 25,060 8 17,455 6
Deposits by banks (including repos) 67,323 19 54,720 17 40,038 14
Debt securities in issue 41,016 11 33,938 10 30,669 11
Short positions 19,128 5 16,381 5 14,622 5
Total 364,430 100 324,200 100 284,324 100
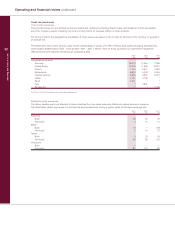
Net customer activity
Net customer lending rose by £11,240 million as the growth in loans and advances to customers exceeded the growth in customer
accounts, thus increasing wholesale market funding to support loan growth. Structural liquidity risk continues to be maintained well
within the Group’s policy parameters.
2003 2002 2001
£m £m £m
Loans and advances to customers (gross, excluding reverse repos) 232,384 205,303 182,549
Customer accounts (excluding repos) 209,942 194,101 181,540
Customer lending less customer accounts 22,442 11,202 1,009
Customer accounts as % of loans and advances to customers (gross, excluding repos) 90.3% 94.5% 99.4%
In prevailing economic conditions and with interest rates at
historically low levels in the UK, US and Europe, the growth in
demand for borrowing by customers may in the medium term
continue to exceed customer deposits received, thus
increasing net customer lending further. The Group has
evaluated a range of balance sheet management strategies
and has developed plans to increase gradually over time short
term and longer term funding from various wholesale market
sources, whilst maintaining its overall funding structure within
its normal prudent liquidity risk policy parameters.