RBS 2003 Annual Report Download - page 198
Download and view the complete annual report
Please find page 198 of the 2003 RBS annual report below. You can navigate through the pages in the report by either clicking on the pages listed below, or by using the keyword search tool below to find specific information within the annual report.-
 1
1 -
2
-
3
-
4
-
5
-
6
-
7
-
8
-
9
-
10
-
11
-
12
-
13
-
14
-
15
-
16
-
17
-
18
-
19
-
20
-
21
-
22
-
23
-
24
-
25
-
26
-
27
-
28
-
29
-
30
-
31
-
32
-
33
-
34
-
35
-
36
-
37
-
38
-
39
-
40
-
41
-
42
-
43
-
44
-
45
-
46
-
47
-
48
-
49
-
50
-
51
-
52
-
53
-
54
-
55
-
56
-
57
-
58
-
59
-
60
-
61
-
62
-
63
-
64
-
65
-
66
-
67
-
68
-
69
-
70
-
71
-
72
-
73
-
74
-
75
-
76
-
77
-
78
-
79
-
80
-
81
-
82
-
83
-
84
-
85
-
86
-
87
-
88
-
89
-
90
-
91
-
92
-
93
-
94
-
95
-
96
-
97
-
98
-
99
-
100
-
101
-
102
-
103
-
104
-
105
-
106
-
107
-
108
-
109
-
110
-
111
-
112
-
113
-
114
-
115
-
116
-
117
-
118
-
119
-
120
-
121
-
122
-
123
-
124
-
125
-
126
-
127
-
128
-
129
-
130
-
131
-
132
-
133
-
134
-
135
-
136
-
137
-
138
-
139
-
140
-
141
-
142
-
143
-
144
-
145
-
146
-
147
-
148
-
149
-
150
-
151
-
152
-
153
-
154
-
155
-
156
-
157
-
158
-
159
-
160
-
161
-
162
-
163
-
164
-
165
-
166
-
167
-
168
-
169
-
170
-
171
-
172
-
173
-
174
-
175
-
176
-
177
-
178
-
179
-
180
-
181
-
182
-
183
-
184
-
185
-
186
-
187
-
 188
188 -
 189
189 -
 190
190 -
 191
191 -
 192
192 -
 193
193 -
 194
194 -
 195
195 -
 196
196 -
 197
197 -
 198
198 -
 199
199 -
 200
200 -
 201
201 -
 202
202 -
 203
203 -
 204
204 -
 205
205 -
 206
206 -
 207
207 -
 208
208 -
209
-
210
-
211
-
212
-
213
-
214
-
215
-
216
-
217
-
218
-
219
-
220
-
221
-
222
-
223
-
224
-
225
-
226
-
227
-
228
-
229
-
230
 |
 |

196
Notes on the accounts continued
Notes on the accounts
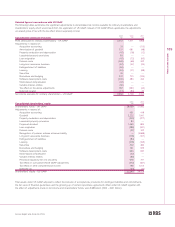
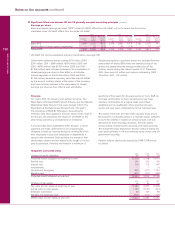
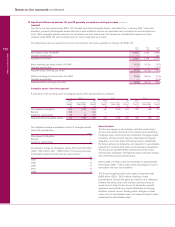
53 Significant differences between UK and US generally accepted accounting principles (continued)
Goodwill
The Group has fully implemented SFAS 142 ‘Goodwill and Other Intangible Assets’, with effect from 1 January 2002. Under this
standard, goodwill and intangible assets deemed to have indefinite lives are not amortised and are subject to annual impairment
tests. Other intangible assets continue to be amortised over their useful lives. The Group has completed the impairment tests
required under SFAS 142 and no impairment has been recognised as a result.
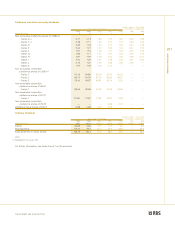
The table below sets out reported net income reconciled to net income adjusted to comply with SFAS 142.
2003 2002 2001
£m £m £m
Net income under US GAAP 2,564 3,108 2,062
Goodwill amortisation — — 657
Adjusted net income 2,564 3,108 2,719
Basic earnings per share under US GAAP 87.5p 107.9p 74.7p
Goodwill amortisation — — 23.7p
Adjusted basic earnings per share 87.5p 107.9p 98.4p
Diluted earnings per share under US GAAP 86.8p 106.3p 73.2p
Goodwill amortisation — — 23.3p
Adjusted diluted earnings per share 86.8p 106.3p 96.5p
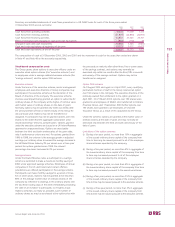
Securitisations
The Group engages in securitisation activities pertaining to
certain of its assets including US commercial and residential
mortgage loans, commercial and residential mortgage related
securities, US Government agency collateralised mortgage
obligations, and other types of financial assets. Additionally,
the Group acts as an underwriter and depositor in securitisation
transactions involving both client and proprietary transactions.
The Group has classified these activities into three broad
securitisation categories, US Agency based, consumer based,
and commercial based securitisations.
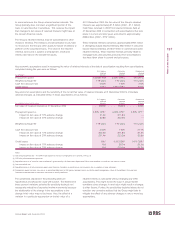
During 2003, the Group received proceeds of approximately
£37.5 billion (2002 – £26.2 million) from securitisation trusts in
connection with new securitisations.
The Group recognised net pre-tax gains of approximately
£58.8 million (2002 – £83.0 million) relating to these
securitisations. Net pre-tax gains are based on the difference
between the sales prices and previous carrying values of
assets prior to date of sale, are net of transaction specific
expenses, and exclude any results attributable to hedging
activities, interest income, funding costs, changes in asset
values prior to securitisation date, and retained interest values
subsequent to securitisation date.
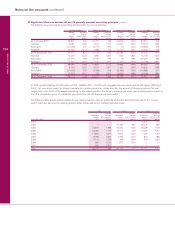
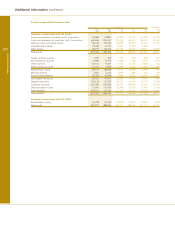
Intangible assets other than goodwill
A summary of the carrying value of intangible assets other than goodwill is as follows:
2003 2002 2001
Gross Net Gross Net Gross Net
carrying Accumulated carrying carrying Accumulated carrying carrying Accumulated carrying
amount amortisation amount amount amortisation amount amount amortisation amount
£m £m £m £m £m £m £m £m £m.
Core deposit intangibles 459 (149) 310 461 (108) 353 487 (66) 421
Brands 338 — 338 ——————
Customer relationships 128 (6) 122 ——————
Total amortising intangible assets 925 (155) 770 461 (108) 353 487 (66) 421
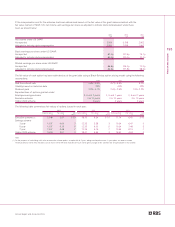
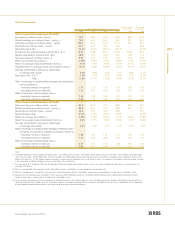
The weighted average amortisation period of intangible assets
other than goodwill are:
Years
Core deposit intangibles 7
Brands —
Customer relationships 9
Amortisation charge on intangibles during 2003 was £62 million
(2002 – £50 million; 2001 – £699 million). The Group estimates
amortisation expense for the next five years will be :
£m
2004 73
2005 73
2006 73
2007 73
2008 71