RBS 2003 Annual Report Download - page 76
Download and view the complete annual report
Please find page 76 of the 2003 RBS annual report below. You can navigate through the pages in the report by either clicking on the pages listed below, or by using the keyword search tool below to find specific information within the annual report.-
 1
1 -
2
-
3
-
4
-
5
-
6
-
7
-
8
-
9
-
10
-
11
-
12
-
13
-
14
-
15
-
16
-
17
-
18
-
19
-
20
-
21
-
22
-
23
-
24
-
25
-
26
-
27
-
28
-
29
-
30
-
31
-
32
-
33
-
34
-
35
-
36
-
37
-
38
-
39
-
40
-
41
-
42
-
43
-
44
-
45
-
46
-
47
-
48
-
49
-
50
-
51
-
52
-
53
-
54
-
55
-
56
-
57
-
58
-
59
-
60
-
61
-
62
-
63
-
64
-
65
-
 66
66 -
 67
67 -
 68
68 -
 69
69 -
 70
70 -
 71
71 -
 72
72 -
 73
73 -
 74
74 -
 75
75 -
 76
76 -
 77
77 -
 78
78 -
 79
79 -
 80
80 -
 81
81 -
 82
82 -
 83
83 -
 84
84 -
 85
85 -
 86
86 -
87
-
88
-
89
-
90
-
91
-
92
-
93
-
94
-
95
-
96
-
97
-
98
-
99
-
100
-
101
-
102
-
103
-
104
-
105
-
106
-
107
-
108
-
109
-
110
-
111
-
112
-
113
-
114
-
115
-
116
-
117
-
118
-
119
-
120
-
121
-
122
-
123
-
124
-
125
-
126
-
127
-
128
-
129
-
130
-
131
-
132
-
133
-
134
-
135
-
136
-
137
-
138
-
139
-
140
-
141
-
142
-
143
-
144
-
145
-
146
-
147
-
148
-
149
-
150
-
151
-
152
-
153
-
154
-
155
-
156
-
157
-
158
-
159
-
160
-
161
-
162
-
163
-
164
-
165
-
166
-
167
-
168
-
169
-
170
-
171
-
172
-
173
-
174
-
175
-
176
-
177
-
178
-
179
-
180
-
181
-
182
-
183
-
184
-
185
-
186
-
187
-
188
-
189
-
190
-
191
-
192
-
193
-
194
-
195
-
196
-
197
-
198
-
199
-
200
-
201
-
202
-
203
-
204
-
205
-
206
-
207
-
208
-
209
-
210
-
211
-
212
-
213
-
214
-
215
-
216
-
217
-
218
-
219
-
220
-
221
-
222
-
223
-
224
-
225
-
226
-
227
-
228
-
229
-
230
 |
 |

Operating and financial review continued
74
Operating and financial review
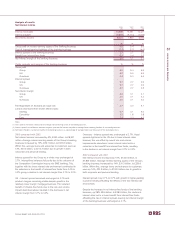
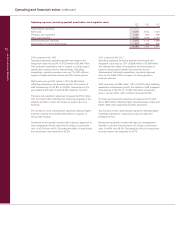
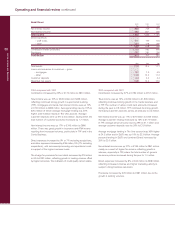
Taxation
2003 2002 2001
£m £m £m
Tax on profit on ordinary activities 1,910 1,556 1,537
%%%
UK corporation tax rate 30.0 30.0 30.0
Effective tax rate 31.0 32.7 36.1
The actual tax charge differs from the expected tax charge computed by applying the standard rate of UK corporation tax
as follows:
2003 2002 2001
£m £m £m
Expected tax charge 1,848 1,429 1,276
Goodwill amortisation 200 183 169
Contributions to employee share schemes (35) (40) (48)
Non-deductible items 231 179 251
Non-taxable items (207) (163) (92)
Capital allowances in excess of depreciation (626) (340) (280)
Other 13 7 (7)
Adjustments in respect of prior periods (77) (15) 15
Current tax charge for year 1,347 1,240 1,284
Deferred taxation:
Origination and reversal of timing differences 598 372 255
Adjustments in respect of prior periods (35) (56) (2)
Actual tax charge 1,910 1,556 1,537
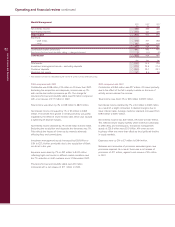
2003 compared with 2002
Gross new provisions were up 11%, £158 million to £1,566 million.
Recoveries of amounts previously written off were up £9 million,
14%, to £72 million. Consequently the net charge to the profit
and loss account was up £149 million, 11% to £1,494 million.
Bad debt provisions amounted to £1,461 million compared with
£1,286 million in 2002, an increase of 14%. The increased
charge was in line with the growth in lending during 2003.
Amounts written off fixed asset investments, largely in the
second half of the year, were down £26 million to £33 million
compared with £59 million in 2002.
Total balance sheet provisions for bad and doubtful debts
amounted to £3,929 million compared with £3,927 million at
31 December 2002. Total provision coverage (the ratio of total
balance sheet provisions to total risk elements in lending) was
76% compared with 81% at 31 December 2002.
The ratio of total balance sheet provisions to total risk elements
in lending and potential problem loans increased to 68%
compared with 65% at 31 December 2002.
2002 compared with 2001
Gross new provisions were up 31%, £337 million to £1,408
million. The increase reflects growth in overall lending and as
in the second half of 2001, provisions required in a number of
specific corporate situations. Recoveries of amounts previously
written off were down £17 million, 21%, to £63 million.
Consequently the net charge to the profit and loss account
was up £354 million, 36% to £1,345 million.
Bad debt provisions amounted to £1,286 million compared with
£984 million in 2001. The charge reflects overall growth in
lending and is particularly influenced by provisions required
against a number of specific corporate situations. Amounts
written off fixed asset investments, largely in the first half of the
year, were £59 million against £7 million in 2001.
Total balance sheet provisions for bad and doubtful debts
amounted to £3,927 million, up 8% from £3,653 million at
31 December 2001. Total provision coverage (the ratio of total
balance sheet provisions to risk elements in lending) at
31 December 2002 was maintained at 81%.
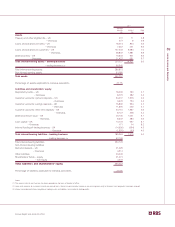
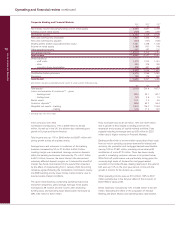
Provisions
2003 2002 2001
£m £m £m
Gross new provisions 1,566 1,408 1,071
less: recoveries (72) (63) (80)
Charge to profit and loss account 1,494 1,345 991
Comprising:
Provisions for bad and doubtful debts 1,461 1,286 984
Amounts written off fixed asset investments 33 59 7
Charge to profit and loss account 1,494 1,345 991