RBS 2003 Annual Report Download - page 67
Download and view the complete annual report
Please find page 67 of the 2003 RBS annual report below. You can navigate through the pages in the report by either clicking on the pages listed below, or by using the keyword search tool below to find specific information within the annual report.-
 1
1 -
2
-
3
-
4
-
5
-
6
-
7
-
8
-
9
-
10
-
11
-
12
-
13
-
14
-
15
-
16
-
17
-
18
-
19
-
20
-
21
-
22
-
23
-
24
-
25
-
26
-
27
-
28
-
29
-
30
-
31
-
32
-
33
-
34
-
35
-
36
-
37
-
38
-
39
-
40
-
41
-
42
-
43
-
44
-
45
-
46
-
47
-
48
-
49
-
50
-
51
-
52
-
53
-
54
-
55
-
56
-
 57
57 -
 58
58 -
 59
59 -
 60
60 -
 61
61 -
 62
62 -
 63
63 -
 64
64 -
 65
65 -
 66
66 -
 67
67 -
 68
68 -
 69
69 -
 70
70 -
 71
71 -
 72
72 -
 73
73 -
 74
74 -
 75
75 -
 76
76 -
 77
77 -
78
-
79
-
80
-
81
-
82
-
83
-
84
-
85
-
86
-
87
-
88
-
89
-
90
-
91
-
92
-
93
-
94
-
95
-
96
-
97
-
98
-
99
-
100
-
101
-
102
-
103
-
104
-
105
-
106
-
107
-
108
-
109
-
110
-
111
-
112
-
113
-
114
-
115
-
116
-
117
-
118
-
119
-
120
-
121
-
122
-
123
-
124
-
125
-
126
-
127
-
128
-
129
-
130
-
131
-
132
-
133
-
134
-
135
-
136
-
137
-
138
-
139
-
140
-
141
-
142
-
143
-
144
-
145
-
146
-
147
-
148
-
149
-
150
-
151
-
152
-
153
-
154
-
155
-
156
-
157
-
158
-
159
-
160
-
161
-
162
-
163
-
164
-
165
-
166
-
167
-
168
-
169
-
170
-
171
-
172
-
173
-
174
-
175
-
176
-
177
-
178
-
179
-
180
-
181
-
182
-
183
-
184
-
185
-
186
-
187
-
188
-
189
-
190
-
191
-
192
-
193
-
194
-
195
-
196
-
197
-
198
-
199
-
200
-
201
-
202
-
203
-
204
-
205
-
206
-
207
-
208
-
209
-
210
-
211
-
212
-
213
-
214
-
215
-
216
-
217
-
218
-
219
-
220
-
221
-
222
-
223
-
224
-
225
-
226
-
227
-
228
-
229
-
230
 |
 |

65
Operating and financial review
Annual Report and Accounts 2003
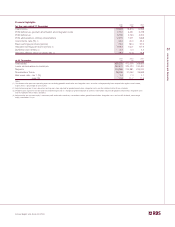
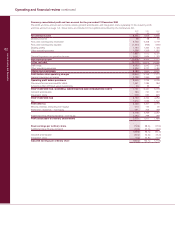
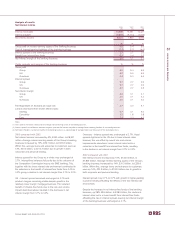
Net interest margin
The Group’s net interest margin remained stable at 3.1%.
Improved lending margins offset the downward pressure on
deposit margins arising from lower interest rates.
Non-interest income
Non-interest income increased by 16%, or £1,254 million, to £8,966
million. Non-interest income accounted for 53% of total income.
Fees and commissions receivable were up 12%, or £573
million. Volume driven increases in lending fees and continued
strong growth in fee paying current accounts contributed to the
increase. Dealing profits at £1,462 million were up £36 million,
3%, on the strong performance in 2001. The increase in
dealing profits resulted from customer led business growth and
higher revenues from trading in interest rate instruments. Other
operating income was £157 million, 15% higher mainly due to
the expansion of CBFM’s operating lease business. General
insurance premium income, after reinsurance, rose by 38%, or
£519 million reflecting Direct Line Group’s organic growth and
acquisitions in Continental Europe.
Operating expenses
Operating expenses, excluding goodwill amortisation and
integration costs, rose by 12%, or £828 million, to £7,669
million. Excluding acquisitions, operating expenses were up 7%,
£469 million in support of strong growth in business volumes.
Cost:income ratio
Strong income growth coupled with tight cost management
resulted in a further improvement in the Group’s cost:income
ratio, to 44.0% from 45.3%. Excluding the effect of
acquisitions, the cost:income ratio improved to 43.7%.
Net insurance claims
General insurance claims, after reinsurance, increased by
42%, or £402 million, to £1,350 million reflecting significant
volume growth and acquisitions at Direct Line.
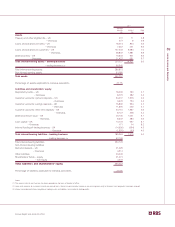
Provisions
The profit and loss charge for provisions was £1,345 million
compared with £991 million in 2001. The charge for the two
halves of the year was consistent with the second half of 2001.
Bad debt provisions amounted to £1,286 million compared with
£984 million in 2001. The charge reflects overall growth in lending
and, as in the second half of 2001, is particularly influenced
by provisions required against a number of specific corporate
situations. Amounts written off fixed asset investments, largely in
the first half of the year, were £59 million against £7 million in 2001.
Total balance sheet provisions for bad debts amounted to
£3,927 million at 31 December 2002, up 8% from £3,653
million at 31 December 2001.
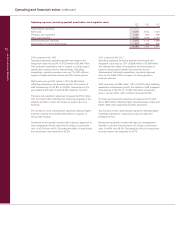
Credit quality
Overall credit quality remains strong with no material change in
the distribution by grade of the Group’s total risk assets
compared with the position at the previous year end.
Risk elements in lending amounted to £4,871 million at
31 December 2002, up 8% from £4,493 million at 31 December
2001, and up 2% from £4,791 million at 30 June 2002.
Total provision coverage (the ratio of total balance sheet
provisions to risk elements in lending) at 31 December 2002
was maintained at 81%.
Risk elements in lending and potential problem loans in
aggregate amounted to £6,054 million, an increase of 9% over
31 December 2001 and 1% over 30 June 2002.
Integration
The Group successfully completed the conversion of NatWest
IT systems on to the RBS technology platform in October 2002.
This programme ran for 30 months and involved more than
4,000 staff, culminating in the migration of a customer base
three times the size of the Royal Bank of Scotland on to a
single technology platform. The scale and complexity of this
project are without precedent.
Annualised revenue benefits of £805 million and annualised
cost savings of £1,350 million were delivered by December
2002. In addition, by February 2003 all integration initiatives
had been completed. As a result the full programme
annualised benefits, comprising £890 million revenue benefits
and £1,440 million cost savings, have been achieved less than
three years after the acquisition of NatWest.
Cumulative combined revenue and cost benefits to the profits
for the period 2000 to 2002 amounted to £3.6 billion, which
was £1.1 billion ahead of the original plan.
In the US, Citizens completed the IT integration of the Mellon
Regional Franchise in August 2002, earlier than planned.
Benefits from this transaction were delivered more quickly than
was envisaged.
Earnings and dividends
Earnings per ordinary share, adjusted for goodwill amortisation,
integration costs and the dividend on Additional Value Shares
(“AVS”), increased by 13% from 127.9p to 144.1p. Basic earnings
per ordinary share increased by 1% from 67.6p to 68.4p,
reflecting the increase in the AVS dividend paid during the year.
A second dividend of 30.0p per share was paid on 2 December
2002 to the holders of AVS issued in connection with the
acquisition of NatWest. By the end of 2002, a total of 45.0p
per AVS had been paid, in accordance with the original
payment schedule.
The total ordinary dividend for the year was 43.7p per ordinary
share, an increase of 15%. The total dividend was covered 3.3
times by earnings before goodwill amortisation, integration
costs and the AVS dividend.