RBS 2003 Annual Report Download - page 143
Download and view the complete annual report
Please find page 143 of the 2003 RBS annual report below. You can navigate through the pages in the report by either clicking on the pages listed below, or by using the keyword search tool below to find specific information within the annual report.-
 1
1 -
2
-
3
-
4
-
5
-
6
-
7
-
8
-
9
-
10
-
11
-
12
-
13
-
14
-
15
-
16
-
17
-
18
-
19
-
20
-
21
-
22
-
23
-
24
-
25
-
26
-
27
-
28
-
29
-
30
-
31
-
32
-
33
-
34
-
35
-
36
-
37
-
38
-
39
-
40
-
41
-
42
-
43
-
44
-
45
-
46
-
47
-
48
-
49
-
50
-
51
-
52
-
53
-
54
-
55
-
56
-
57
-
58
-
59
-
60
-
61
-
62
-
63
-
64
-
65
-
66
-
67
-
68
-
69
-
70
-
71
-
72
-
73
-
74
-
75
-
76
-
77
-
78
-
79
-
80
-
81
-
82
-
83
-
84
-
85
-
86
-
87
-
88
-
89
-
90
-
91
-
92
-
93
-
94
-
95
-
96
-
97
-
98
-
99
-
100
-
101
-
102
-
103
-
104
-
105
-
106
-
107
-
108
-
109
-
110
-
111
-
112
-
113
-
114
-
115
-
116
-
117
-
118
-
119
-
120
-
121
-
122
-
123
-
124
-
125
-
126
-
127
-
128
-
129
-
130
-
131
-
132
-
 133
133 -
 134
134 -
 135
135 -
 136
136 -
 137
137 -
 138
138 -
 139
139 -
 140
140 -
 141
141 -
 142
142 -
 143
143 -
 144
144 -
 145
145 -
 146
146 -
 147
147 -
 148
148 -
 149
149 -
 150
150 -
 151
151 -
 152
152 -
 153
153 -
154
-
155
-
156
-
157
-
158
-
159
-
160
-
161
-
162
-
163
-
164
-
165
-
166
-
167
-
168
-
169
-
170
-
171
-
172
-
173
-
174
-
175
-
176
-
177
-
178
-
179
-
180
-
181
-
182
-
183
-
184
-
185
-
186
-
187
-
188
-
189
-
190
-
191
-
192
-
193
-
194
-
195
-
196
-
197
-
198
-
199
-
200
-
201
-
202
-
203
-
204
-
205
-
206
-
207
-
208
-
209
-
210
-
211
-
212
-
213
-
214
-
215
-
216
-
217
-
218
-
219
-
220
-
221
-
222
-
223
-
224
-
225
-
226
-
227
-
228
-
229
-
230
 |
 |
Annual Report and Accounts 2003
141
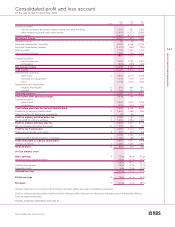
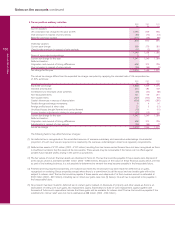
Consolidated profit and loss account
Consolidated profit and loss account
for the year ended 31 December 2003
2003 2002 2001
Note £m £m £m
Interest receivable
– interest receivable and similar income arising from debt securities 1,519 1,591 1,582
– other interest receivable and similar income 12,479 11,970 12,839
Interest payable (5,697) (5,712) (7,575)
Net interest income 8,301 7,849 6,846
Dividend income 58 58 54
Fees and commissions receivable 5,755 5,308 4,735
Fees and commissions payable (1,337) (965) (930)
Dealing profits 11,793 1,462 1,426
Other operating income 1,598 1,209 1,052
7,867 7,072 6,337
General insurance
– earned premiums 3,565 2,383 1,804
– reinsurance (504) (489) (429)
Non-interest income 10,928 8,966 7,712
Total income 19,229 16,815 14,558
Administrative expenses
– staff costs* 24,518 4,472 4,059
– premises and equipment* 1,073 1,006 873
– other* 2,108 2,253 1,903
Depreciation and amortisation
– tangible fixed assets* 20 919 895 881
– goodwill 19 763 731 651
Operating expenses 9,381 9,357 8,367
Profit before other operating charges 9,848 7,458 6,191
General insurance
– gross claims 2,644 1,693 1,263
– reinsurance (449) (343) (315)
Profit before provisions for bad and doubtful debts 7,653 6,108 5,243
Provisions for bad and doubtful debts 13 1,461 1,286 984
Amounts written off fixed asset investments 33 59 7
Profit on ordinary activities before tax 46,159 4,763 4,252
Tax on profit on ordinary activities 51,910 1,556 1,537
Profit on ordinary activities after tax 4,249 3,207 2,715
Minority interests (including non-equity) 32 210 133 90
Profit for the financial year 4,039 3,074 2,625
Preference dividends – non-equity 6261 305 358
3,778 2,769 2,267
Additional Value Shares dividend – non-equity 61,463 798 399
Profit attributable to ordinary shareholders 2,315 1,971 1,868
Ordinary dividends 71,490 1,267 1,085
Retained profit 34 825 704 783
Per 25p ordinary share:
Basic earnings 979.0p 68.4p 67.6p
Additional Value Shares dividend 49.9p 27.7p 14.5p
128.9p 96.1p 82.1p
Goodwill amortisation 25.0p 24.2p 23.2p
Integration costs 5.4p 23.8p 22.6p
Adjusted earnings 159.3p 144.1p 127.9p
Diluted earnings 978.4p 67.4p 66.3p
Dividends 750.3p 43.7p 38.0p
All items dealt with in arriving at profit on ordinary activities before tax relate to continuing operations.
Profit on ordinary activities before taxation and the retained profit for the year on a historical cost basis were not materially different
from the reported amounts.
* includes integration expenditure (see Note 4)